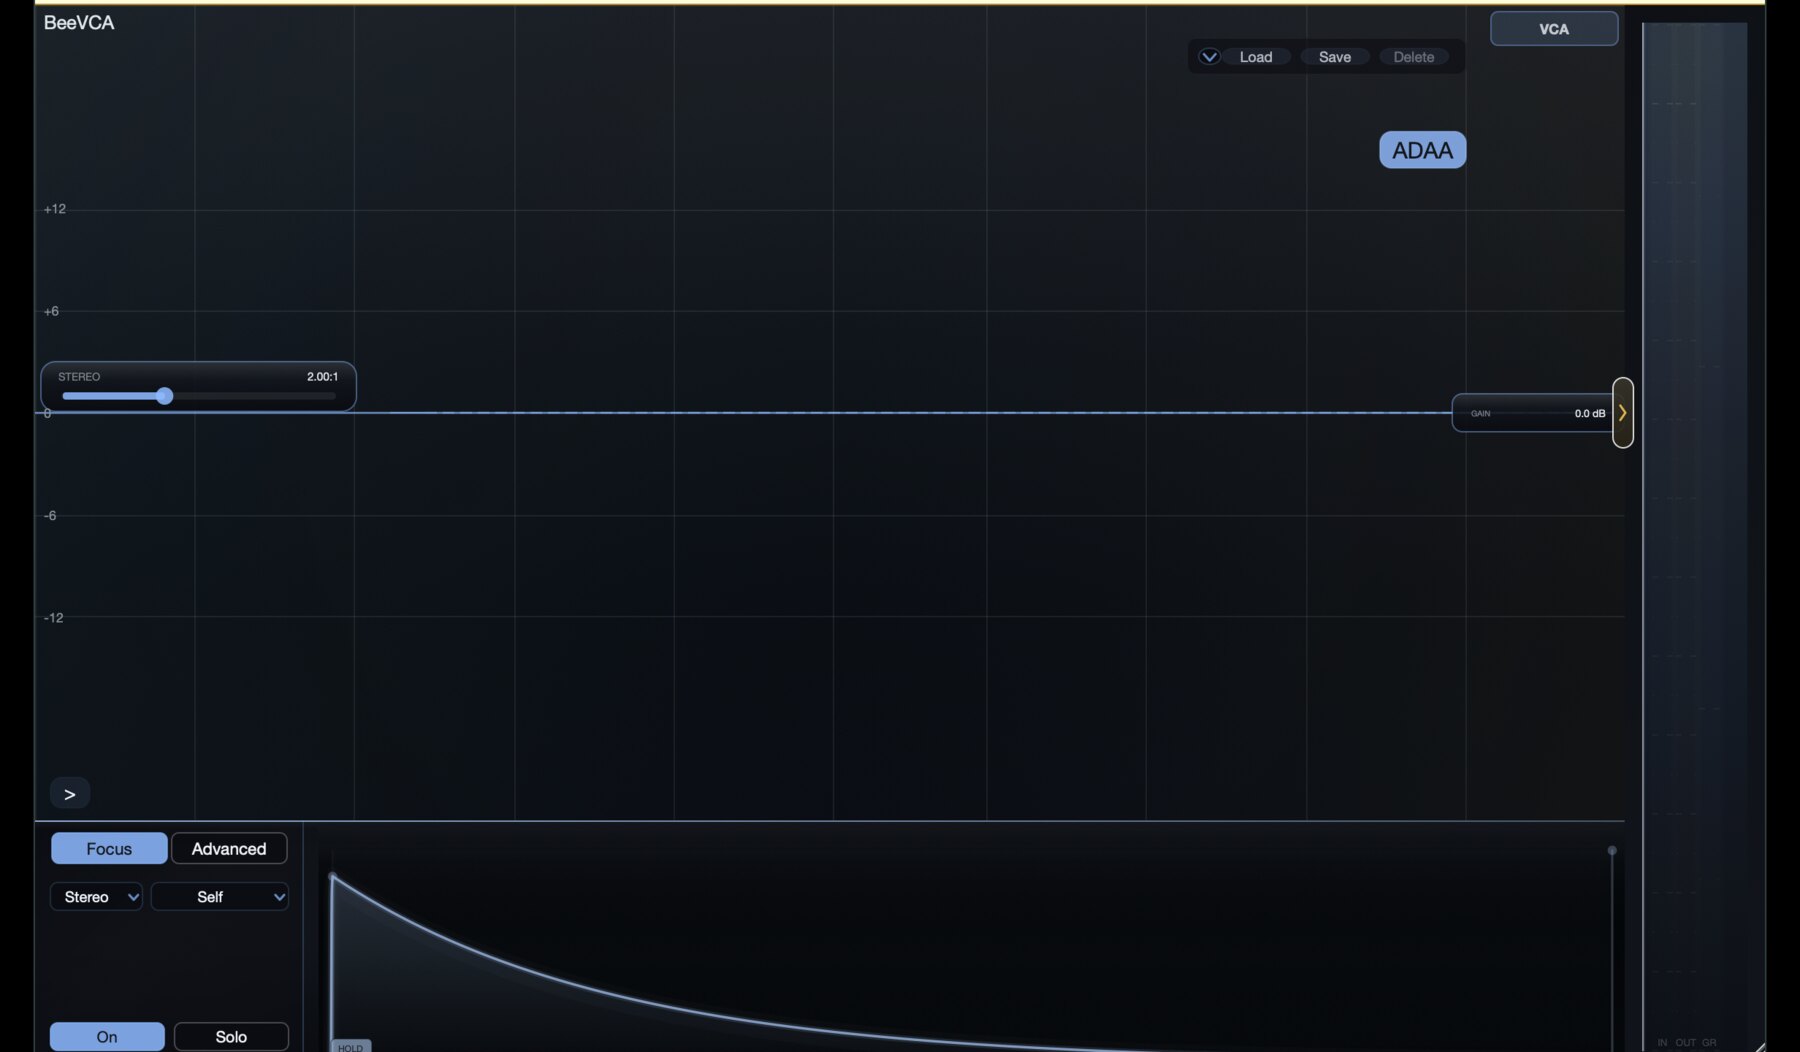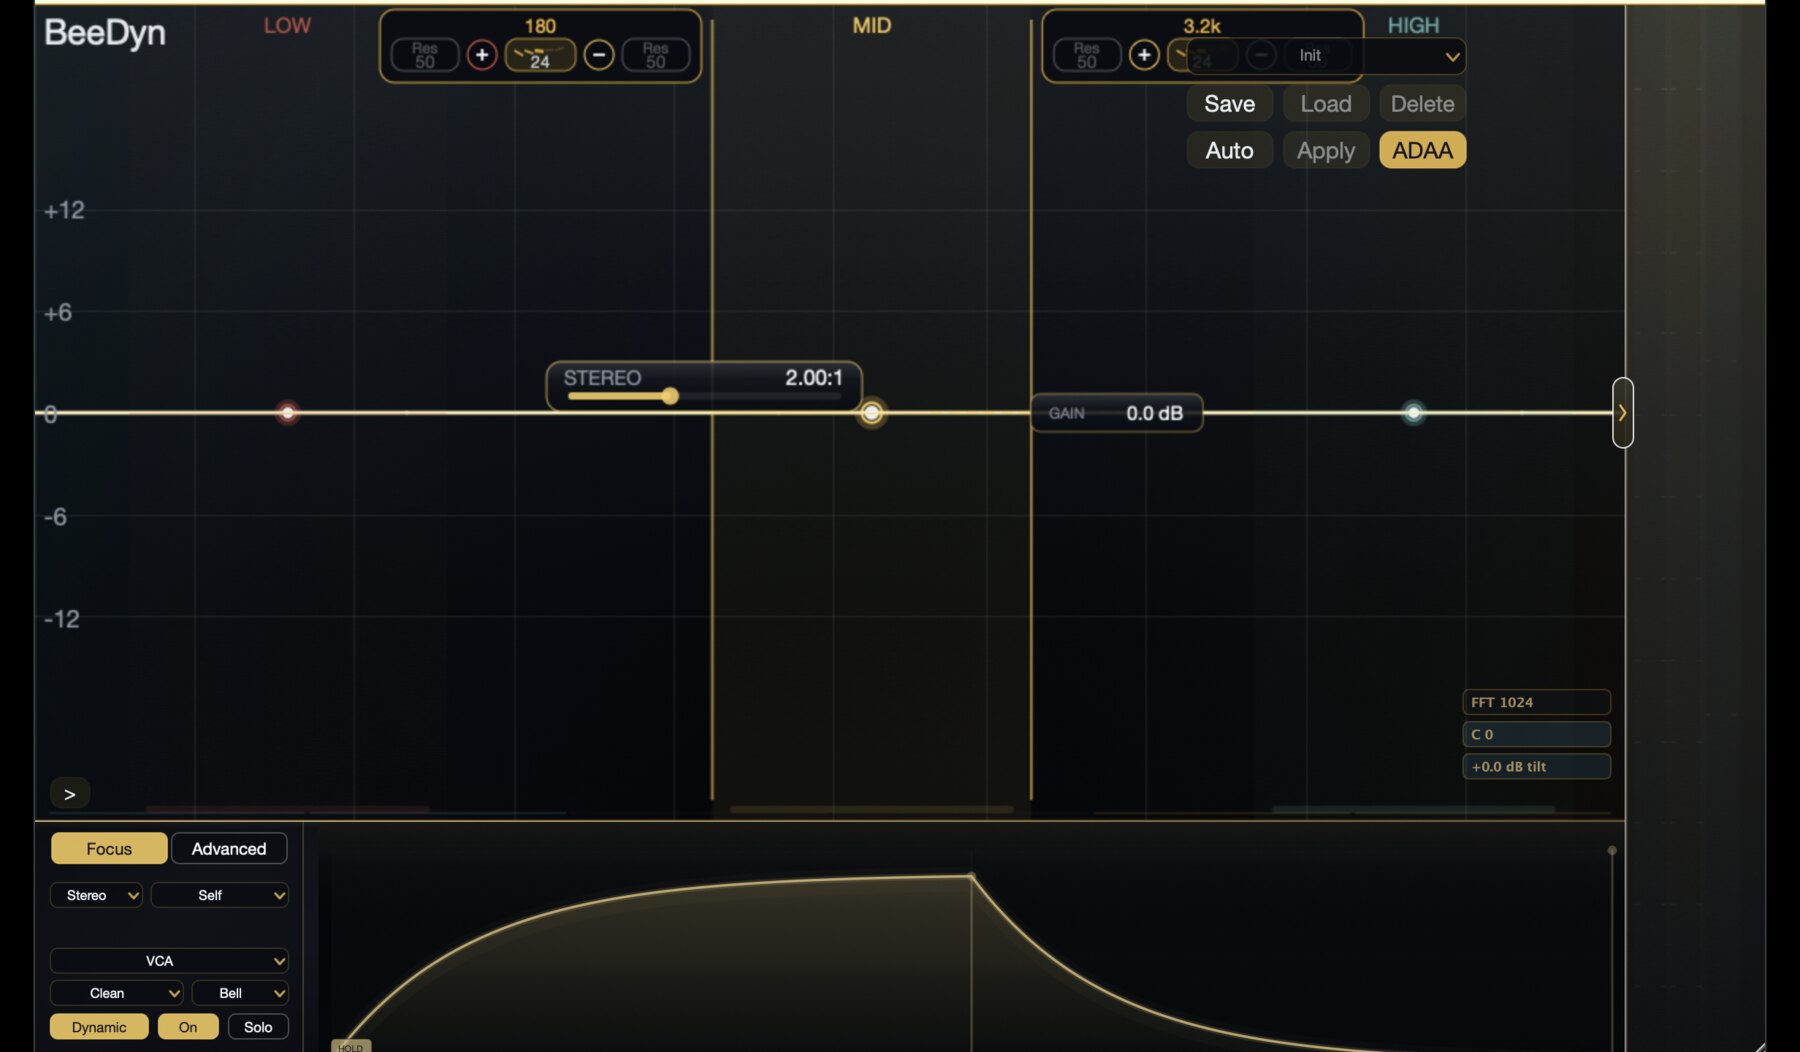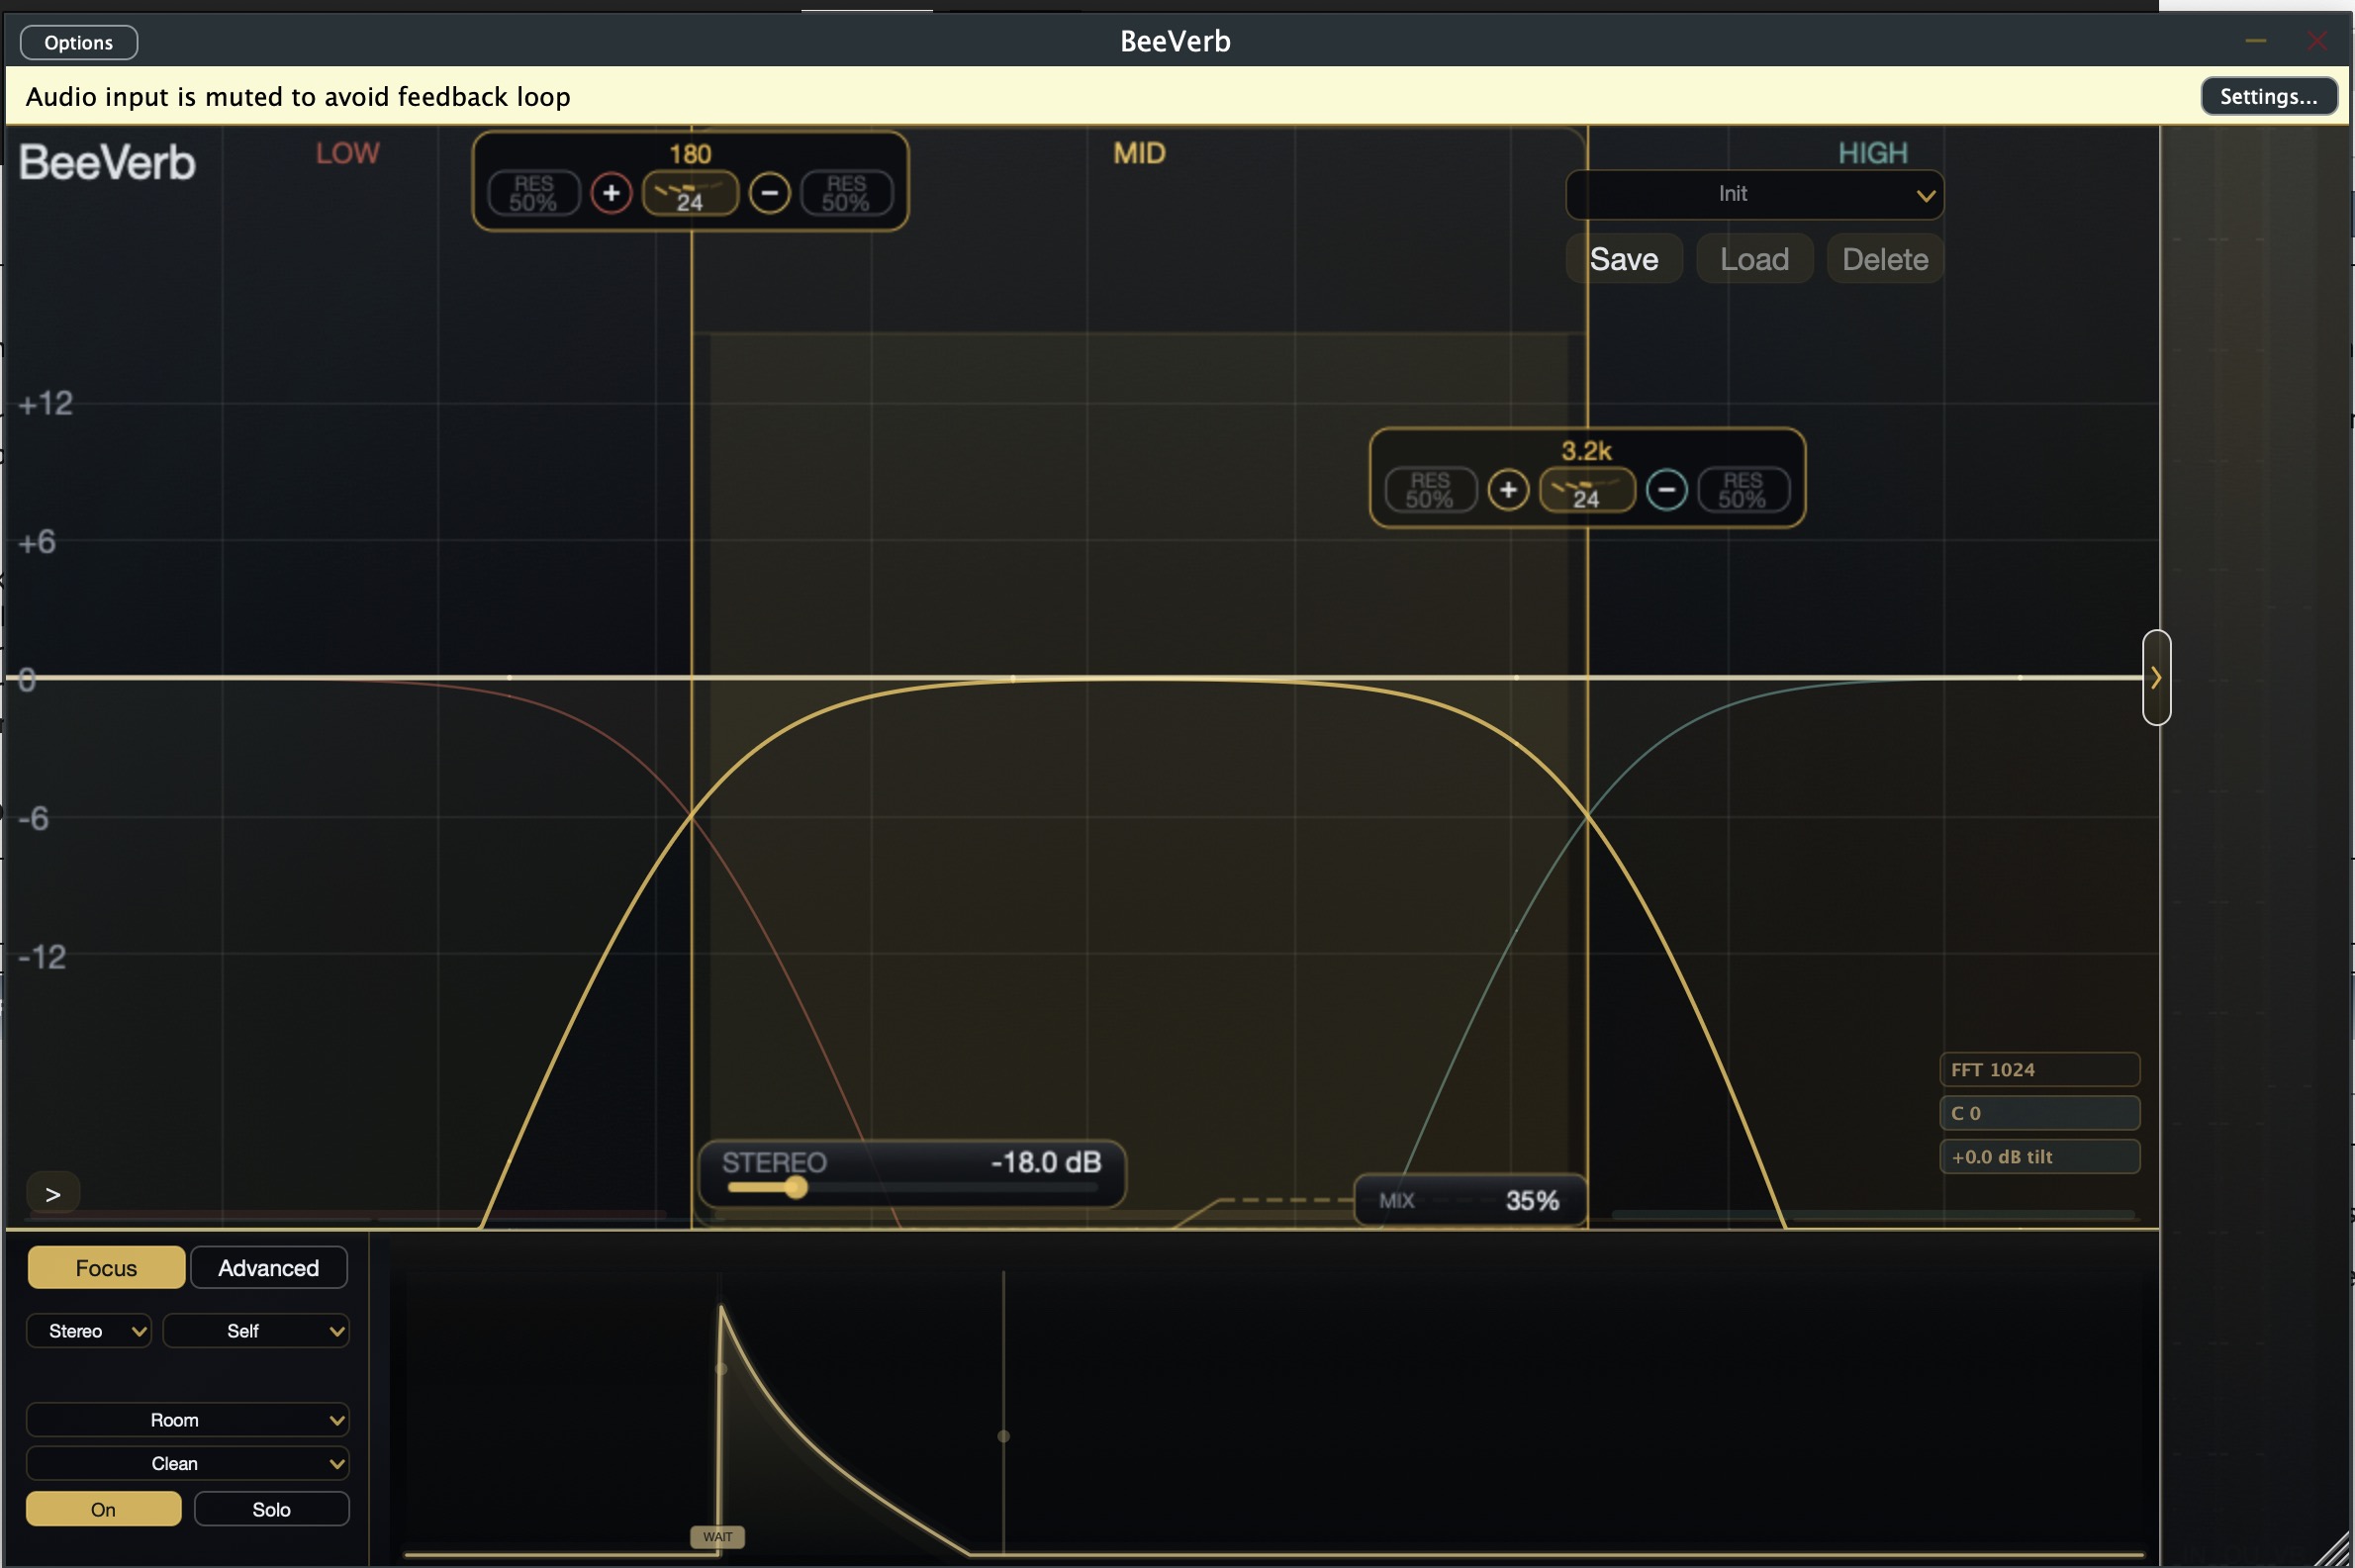
-
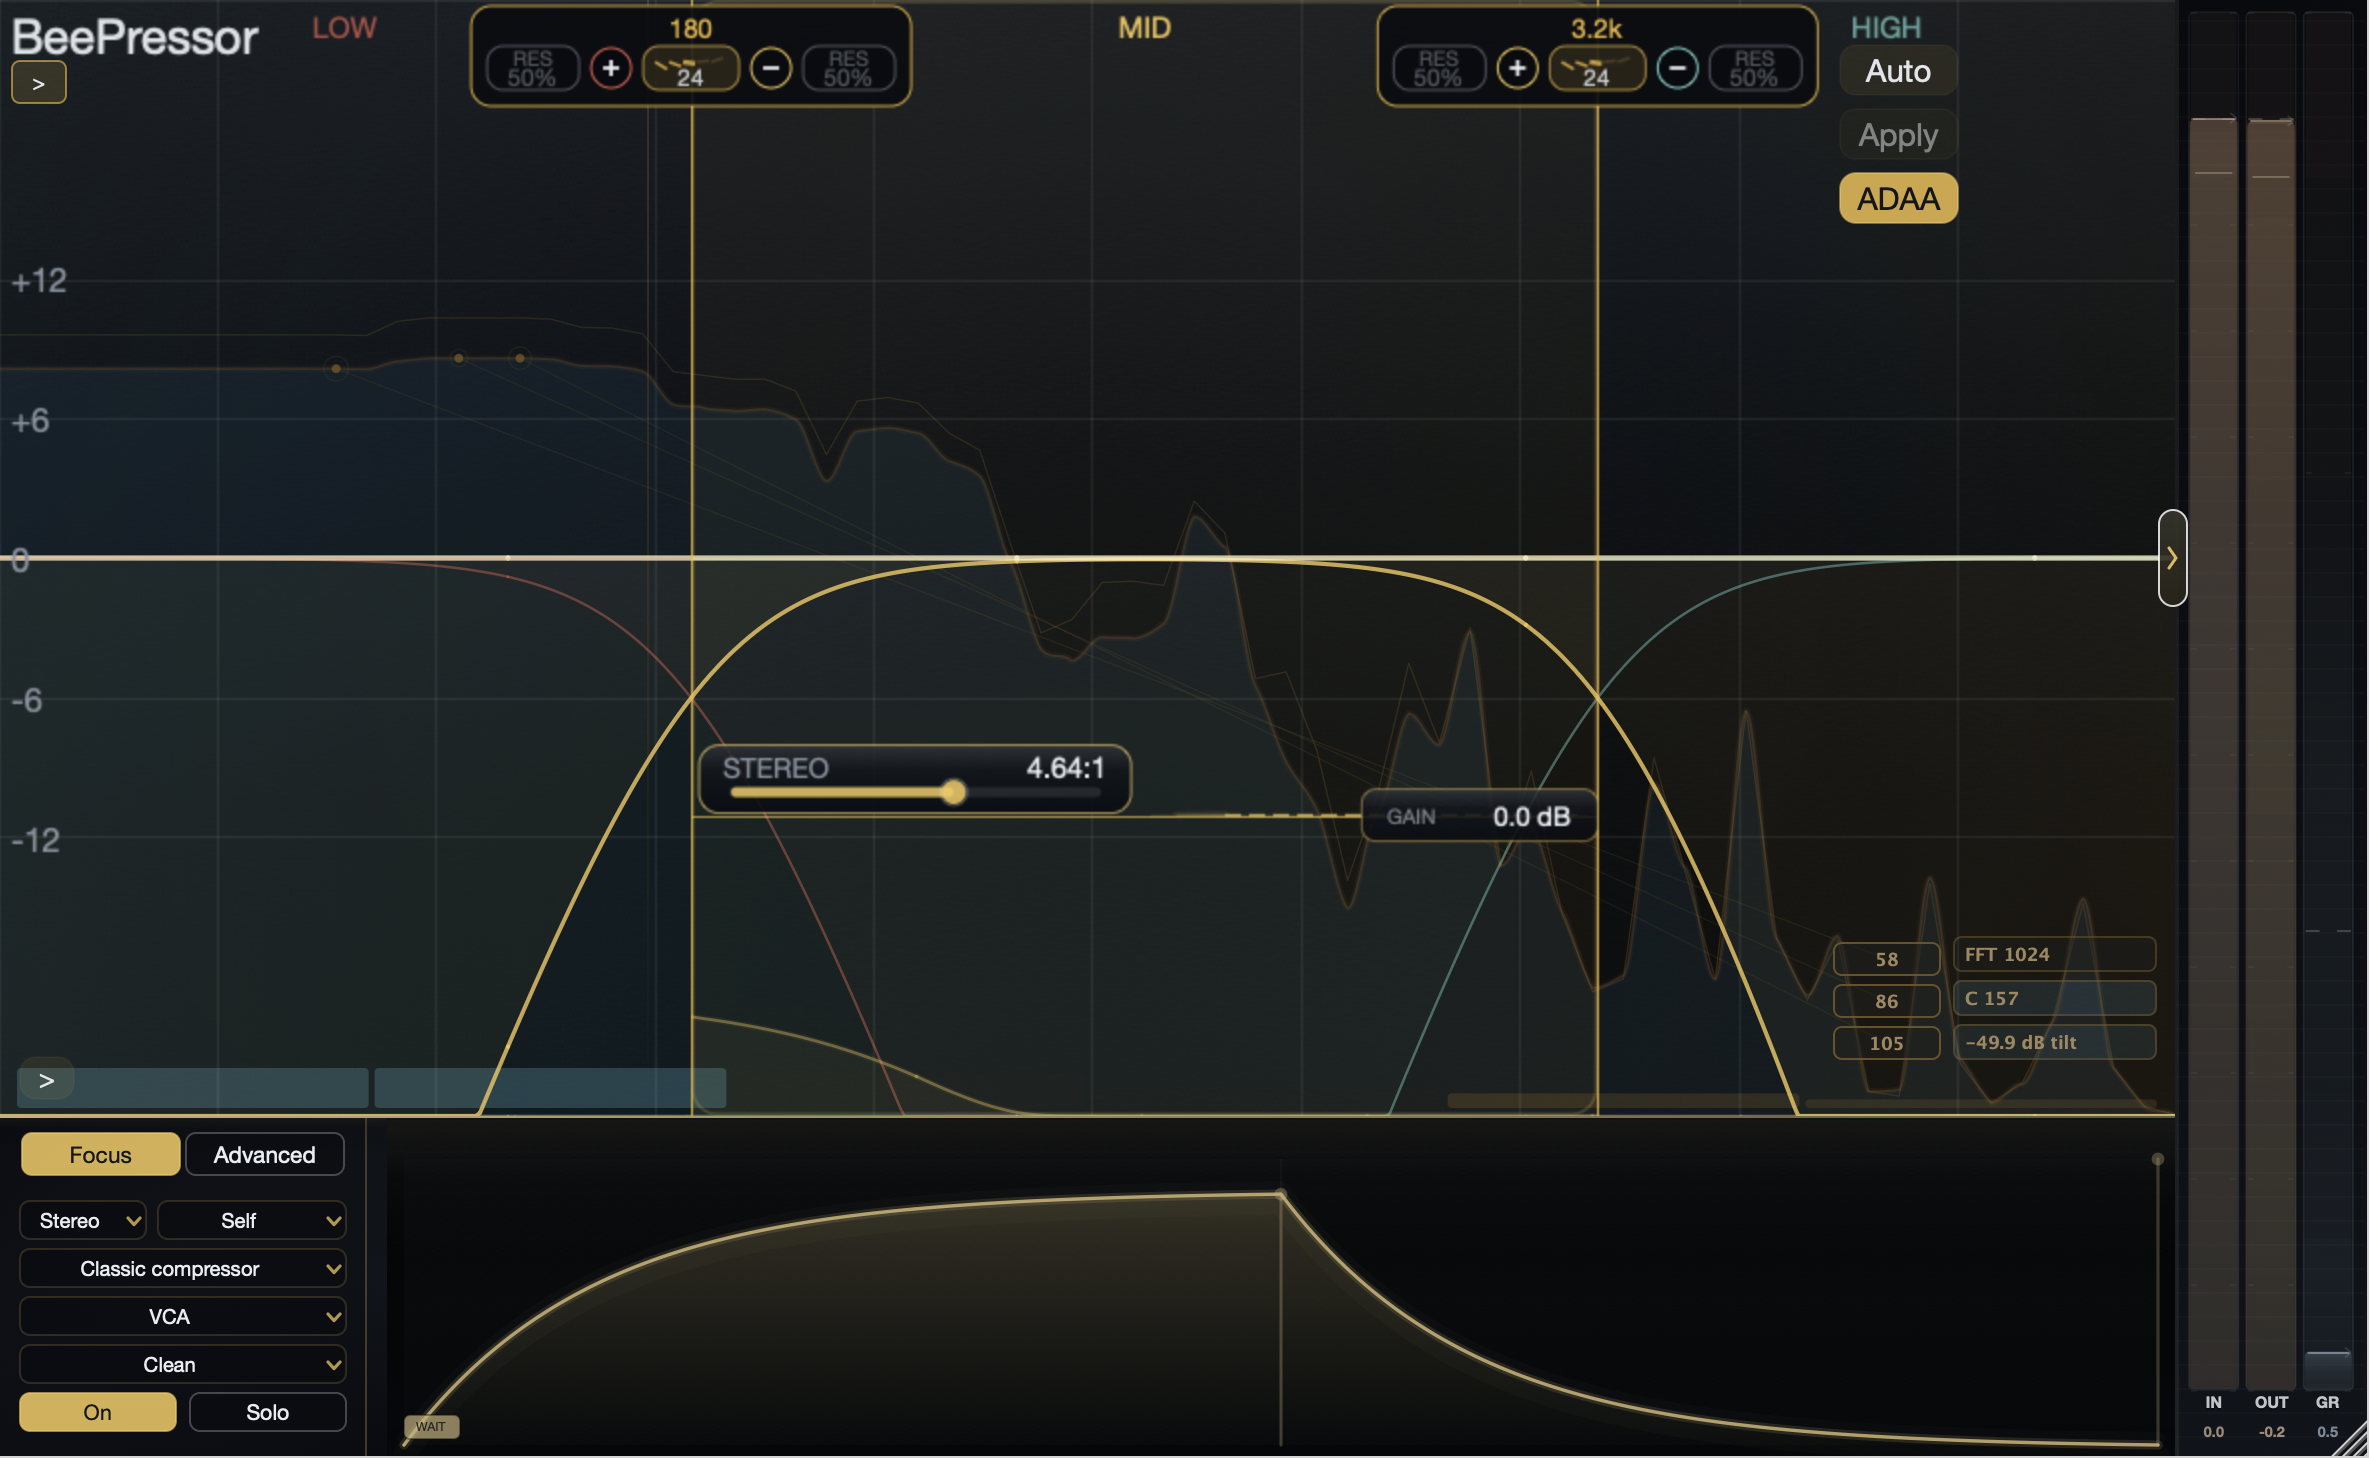
12-band graph Up to 12 compressor bands keep crossover lanes, threshold, ratio, makeup, bandCount, and crossover parameters in the main graph.
-
Filter corners Per-band filter type, resonance, and lower or upper corner shift refine the selected band's reaction edge.
-
Auto/Apply Auto captures source material to suggest thresholds, ratios, and band decisions, then Apply commits the editable starting layout.
-
Threshold/Ratio/Gain Threshold, ratio, and gain controls sit directly on the graph so the focused band can be adjusted without leaving the main view.
-
Crossover slopes Slope controls define how adjacent bands meet, so the graph shows the crossover decision before threshold or detector tuning begins.
-
Band split Split and remove operations keep the active band layout editable without leaving the frequency graph.
-
Focused lane The selected band lane carries the threshold, detector, ratio, and gain context for the current edit.
-
Detector range The detector guide can stay inside the band, widen, or move away from the audio range that receives gain change.
-
Makeup line Makeup is shown as a graph-attached level decision after the compression law has been placed.
-
Band edge handles Band edges remain visible while the focused band is tuned, keeping topology and dynamics connected.
-
Comp model per band Each active band stores its own VCA, FET, OPTO, Vari-Mu, Tape, Custom, or Soft Clip character instead of one global model.
-
Stereo/M/S per band A focused band can work in stereo, mid, or side while keeping channel decisions attached to that band and path.
-
Key: Self/Internal/External Bands can listen to their own range, another key, or the host sidechain as part of the focused per-band detector contract.
-
Classic comp Classic mode exposes VCA, FET, OPTO, Vari-Mu, Tape, Custom, and Soft Clip choices for the focused band.
-
Filter character The band filter character changes how the band edge behaves before resonance and corner shifts refine it.
-
Timing shapes Attack and release shapes describe how gain movement bends between detection and recovery.
-
Two-stage release Two release regions can separate the early recovery feel from the longer return to rest.
-
Auto release Auto-release timing adjusts recovery behavior from program motion while keeping the focused band visible.
-
Custom curve The custom transfer editor is used when the focused band needs a nonstandard gain law.
-
Path inspector The lower inspector keeps the focused path, detector, model, and timing decisions in one local editing area.
-
5-band SC EQ A dedicated detector EQ shapes what the compressor listens to with fixed HP, three bell bands, LP, and one global on/off state.
-
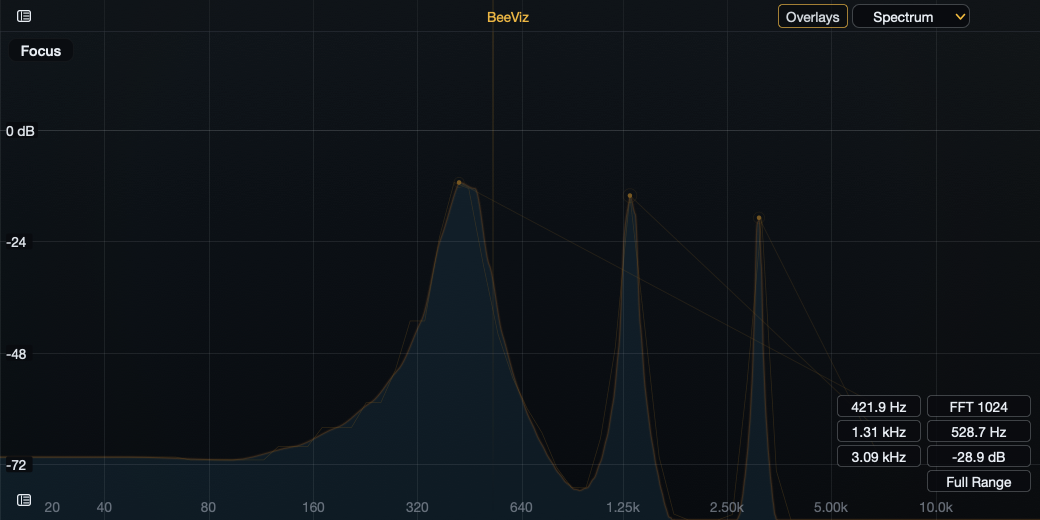
Hi-Res visualizer FFT and Hi-Res analyzer views sit beside crossover and band overlays so spectral behavior stays visible while decisions are made.
-
Delta and meter history Delta from the title shortcut and meter history in inspection views help confirm movement before returning to full output.
-
Input meter Input metering checks gain staging before detector and transfer choices are judged.
-
Output meter Output metering checks level matching after makeup, mix, and recombination.
-
GR history Gain-reduction history shows recent movement so timing problems are visible across phrases.
-
Delta listen Delta isolates the input-minus-output change before the setting is judged in normal output.
-
FFT bins FFT view reveals narrow spectral events while the product graph remains the editing surface.
-
Hi-Res mode Hi-Res visualizer mode uses a denser musical contour view for slower spectral inspection.
-
Detector listen Detector listen auditions what the sidechain path hears before that signal moves compression.