BeeViz Manual
BeeViz analyzes audio at its position in the host signal chain. It provides Spectrum, Spectrogram, Waterfall, and Radial displays, reference comparisons, stereo and loudness meters, rolling statistics, and a monophonic tuner.
System Description
BeeViz passes input audio to the matching output channels without applying gain, filtering, dynamics, or pitch correction. It supports float and double processing and reports zero samples of audio latency. Measurements and display updates still take time.
Input and output layouts must match. Supported layouts are mono, stereo, LCR, quadraphonic, LCRS, 5.0, 5.1, 7.0, and 7.1. Loudness and peak measurement use the active channels. Mid/Side views, correlation, balance, and scopes use the first left/right pair. On mono input, Side is unavailable.
The live spectrum and history displays use the selected FFT bins or the 121-band Hi-Res filterbank, limited by the sample rate. Captured references, linked snapshots, and rolling statistics use a separate 72-bin summary. When several measurements share a history pixel, the display shows the strongest level in that frequency range. A graph peak measures one part of the spectrum; sample peak and true peak measure the audio signal.
The current format configuration is AU, VST3, CLAP, and Standalone on macOS; VST3 and CLAP on Windows and Linux. Use the formats included with your build. The host controls audio routing and processing. BeeViz has one host program, Init, and saves its visual configuration in the host project. It does not expose an automatable audio-parameter bank or pass MIDI through.
Operating Procedures
Inspect a signal
- Insert BeeViz at the point you want to measure, then play audio through that channel.
- Open Controls with the arrow beside the title. Choose Visual Presets → Clean Analyzer for an unobstructed spectrum.
- Set the analyzer resolution and response under Visual Analysis Controls.
- Press and hold the left mouse button directly on the graph for a frequency and level reading. Drag to inspect another point; release to clear the readout. Enable Frequency Lens to inspect a band.
- Open Overlays and select the required comparison, meter, or statistics view.
For a before/after comparison, place one instance before the processor and a second after it. Keep both editors open, give them distinct Instance Name labels, and select the first instance in the second instance's Linked Instance browser. Account for gain changes when interpreting the difference.
Measure a passage
- Enable Loudness Strip in Overlay Manager.
- Stop playback before the passage. Select Reset Meters in Controls.
- Play the passage once. Reset takes effect on the next audio block.
- Read the results or use Export Report. Repeated playback contributes further blocks to integrated loudness until reset or replacement by newer history.
The metering reference specifies the windows, retained history, and differences from compliance metering.
Compare a captured reference
- Play the reference material through BeeViz at the intended level.
- Select Capture Reference for the current spectrum, or Average Reference for a five-second capture.
- Play the comparison material using the same analyzer settings.
- Enable Reference, Delta Spectrum, or Reference Match in Overlay Manager.
- Recapture after changing FFT size, Hi-Res mode, tuning, or response settings if you need equivalent measurement conditions.
For tuning instructions, see Tuner.
Control Surface
| Location | Operation |
|---|---|
| Controls arrow | Opens the left drawer for views, reference capture, presets, A/B, guides, exports, naming, and CPU Mode. The graph contracts to fit beside it. |
| Analyzer settings arrow | Opens Hi-Res, Hold, FFT size, overlap, attack, release, smoothing, and brightness. |
| Overlays | Opens Overlay Manager on the right and closes the Controls drawer. |
| Display selector | Chooses Spectrum, Spectrogram, Waterfall, or Radial. Spectrum and Spectrogram offer a separate Focus button. |
| History controls | Spectrogram has color buttons and Rotate. Waterfall has Buffer. Radial has Zoom, color buttons, Sync, and Buffer. These controls sit on the main display. |
| TUNER | Opens the tuner page. |
| BeeViz title | Opens the theme menu: Light, Nuclear, Marvelous, Damaged, and Reduced Motion. The selected theme is shared across BeeViz instances and formats on this computer. |
| Tips | Controls hover help. The tooltip preference is shared across Bee products. F1 opens the relevant manual help link. |
| Graph context menu | Right-click for Frequency Lens placement, freeze capture, Inspector Dock, quick preset slots 1–4, Copy/Paste Preset, or shortcuts to Overlays and Controls. Quick presets are also available by right-clicking an empty area of the tuner. |
Illustrations were captured on September 22, 2026. Some show only the analyzer panel; the full plugin window also contains TUNER and Tips.
Interaction Rules
Click the graph to give BeeViz keyboard focus. Host shortcuts can intercept these keys.
| Command | Action |
|---|---|
| Command-K / Ctrl-K | Opens Overlay Manager. |
| Type; Backspace | Filters overlay names and keywords; removes the last filter character. |
| Arrow keys; Home / End | Selects an overlay row. Up/Down move within a column; Left/Right move between columns. Home/End select the first/last match. |
| Enter | Activates the selected overlay row. |
| Space / modified Space | Remains available to the host for playback shortcuts. Use a hyphen between overlay search words, such as lufs-meter. |
| Page Up / Page Down | Changes pages in the linked-instance browser. Previous/Next buttons and the mouse wheel also reach peers outside the current page. |
| Shift-click an overlay row | Solos that overlay. |
| Shift-click a linked peer | Pins or unpins its name. |
| Shift-T | Toggles the tuner. |
| Escape | Closes the tuner, active overlay panel, linked browser, or Controls drawer. |
| Command-F / Ctrl-F | Toggles full screen when the containing window supports the command. |
Visual Analysis Controls
The illustrations use test signals and example data to show the controls and displays. Their readings are not measurements of a recording.
Spectrum and spectrogram
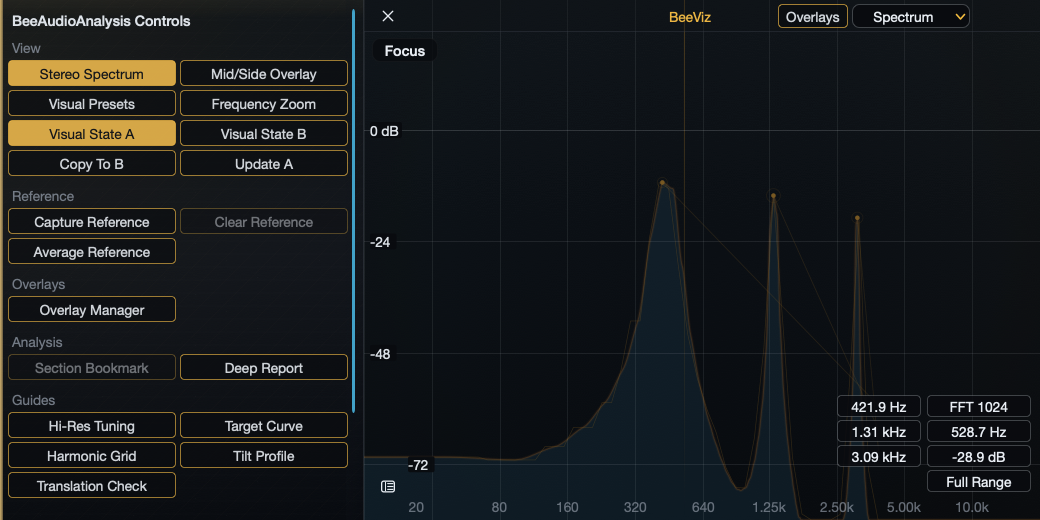
Stereo Spectrum displays the combined input spectrum. Frequency increases from left to right on a logarithmic axis; height shows spectral level. The horizontal guides mark 0, −24, −48, and −72 dB, including in Focus. On multichannel input the spectrum combines channel power, so it does not identify individual surround channels.
Mid/Side Overlay draws Mid and Side curves over a faint stereo spectrum. Mid and Side use distinct colors identified by the legend. The analysis matrix is Mid = (L + R) / √2, Side = (L − R) / √2. Matching left/right signals produce no Side component. Opposite-polarity signals can cancel in Mid. Use the host's mono monitoring to check the audible result.
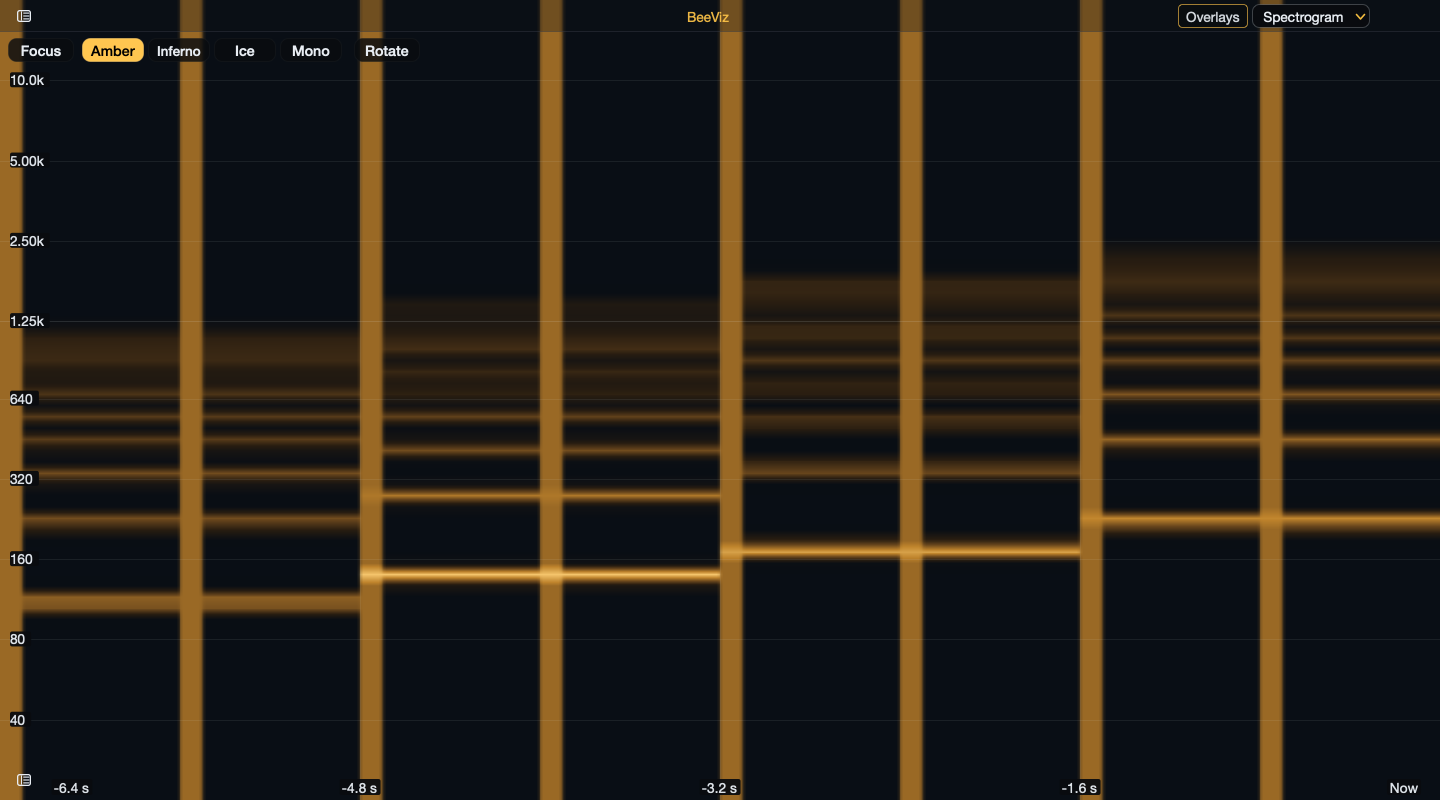
Spectrogram fills the main graph with time/frequency history. By default, low frequencies are at the bottom and new columns enter at the right. Color intensity represents visual level; age alone does not dim an older column. Stereo and Mid/Side selections apply to this view too. Overlays adapt into frequency guides, time contours, edge indicators, or panels.
Amber, Inferno, Ice, and Mono select the level color scale without clearing history. Mid/Side adds a separate Side tint. Rotate turns the display a quarter-turn: frequency increases from left to right, with newest history at the bottom. Axes, selections, and cursor readings follow the orientation.
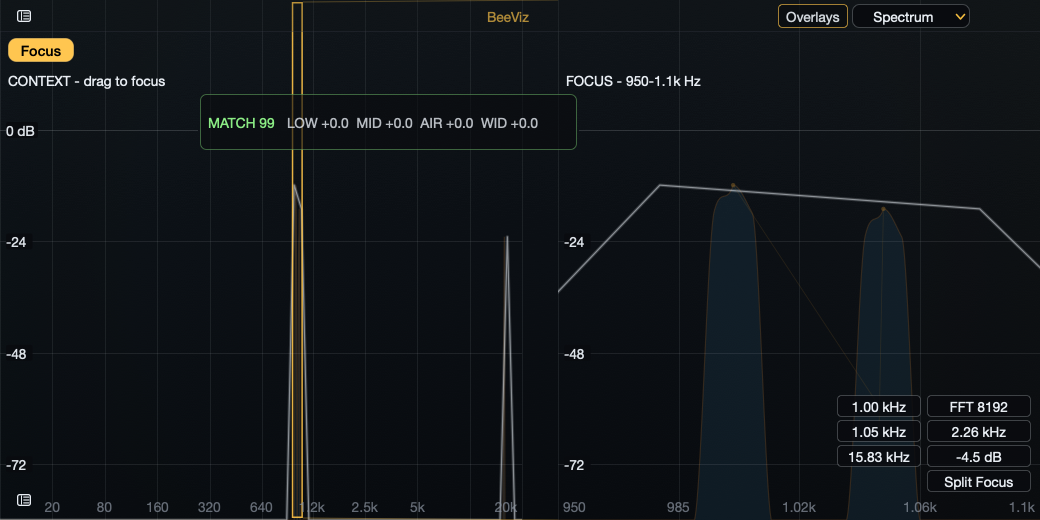
Focus splits Spectrogram into a full-history overview on the left and a magnified region on the right. Drag a rectangle in the overview to select the time and frequency range. Double-click the overview, or choose Reset Focus Region from the context menu, to reset it. Rotate affects both panes. Focus uses the stored measurements and can reveal detail too fine for the overview. The selected region follows the scrolling history. Age labels use the captured frame times, including the endpoints of the focused region. Empty history has no age labels.
Spectrogram retains 192 columns and scrolls with each display update, repeating the latest measurement between FFT updates. Larger FFT windows take longer to measure a change, but scrolling continues between measurements. Hold freezes the history. When the host stops supplying audio, new columns stop. The time covered depends on analyzer and host scheduling. Changing FFT size, overlap, Hi-Res, or Hi-Res Tuning clears history and section bookmarks. Switching between the three history displays retains collected frames; returning from Spectrum starts fresh history.
Spectrum Focus and readout shortcuts
Spectrum’s Focus button keeps the overview on the left and magnifies the Frequency Lens range on the right. Drag across the overview or select a peak to change that range. Spectrum Focus and Spectrogram Focus have independent saved settings. Stereo, Mid/Side, reference curves, and cursor inspection use each pane’s frequency scale.
The compact buttons at Spectrum’s lower right show current values. Hover for the control name and action:
| Control | Click action |
|---|---|
| Peak 1–3 | Centers Frequency Lens on the selected resolved peak. Its frequency stays fixed as live peaks change. Click the selected peak again to clear the lens; moving or disabling the lens clears the selection highlight. Pointer lines identify the peaks on the graph. |
| Resolution | Selects an FFT size or Hi-Res analysis. |
| Centroid | Toggles the rolling Spectral Fingerprint panel. The button itself reports the live spectral center on a logarithmic frequency scale. |
| Tilt | Opens the measured high-minus-low level difference and its contributing frequency bands. This is separate from the Tilt Profile guide. |
| Zoom | Selects the visible frequency range, Lens Focus, Lens Focus + Context (the Split Focus readout), or Full Range. |
Waterfall
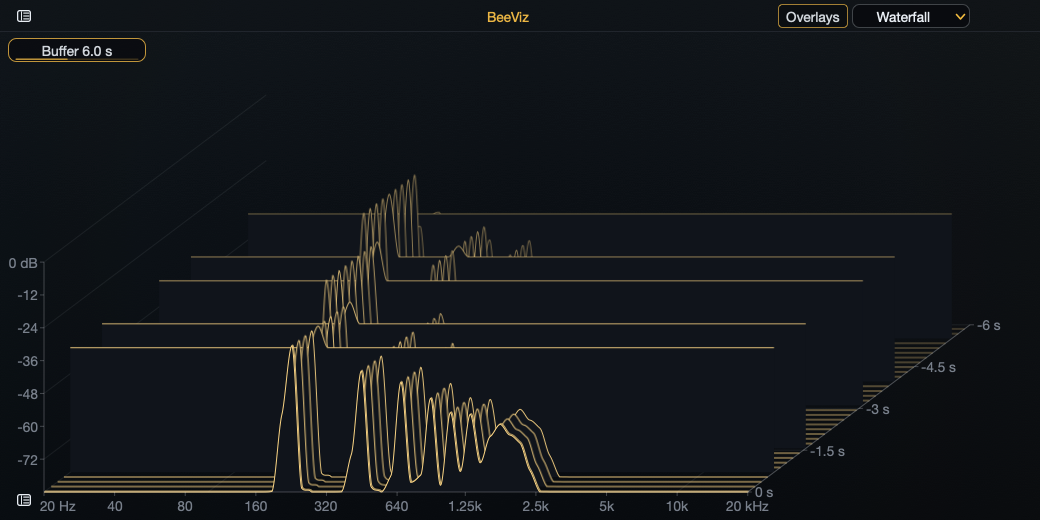
Select Waterfall to draw recent spectra in a fixed 3D view. Frequency runs across the front on a logarithmic scale, level rises linearly in dB, and time recedes into the graph. The axes follow the slices. Each slice keeps its shape as it moves backward; the front curve shows current input.
Buffer sets the visible history to 1–30 seconds of real time. Drag left/right or scroll to adjust; double-click resets to 6 seconds. The time scale remains fixed while history fills. Brightness affects existing slices, including held history, without moving their level coordinates. Hold freezes the history and its clock.
Radial
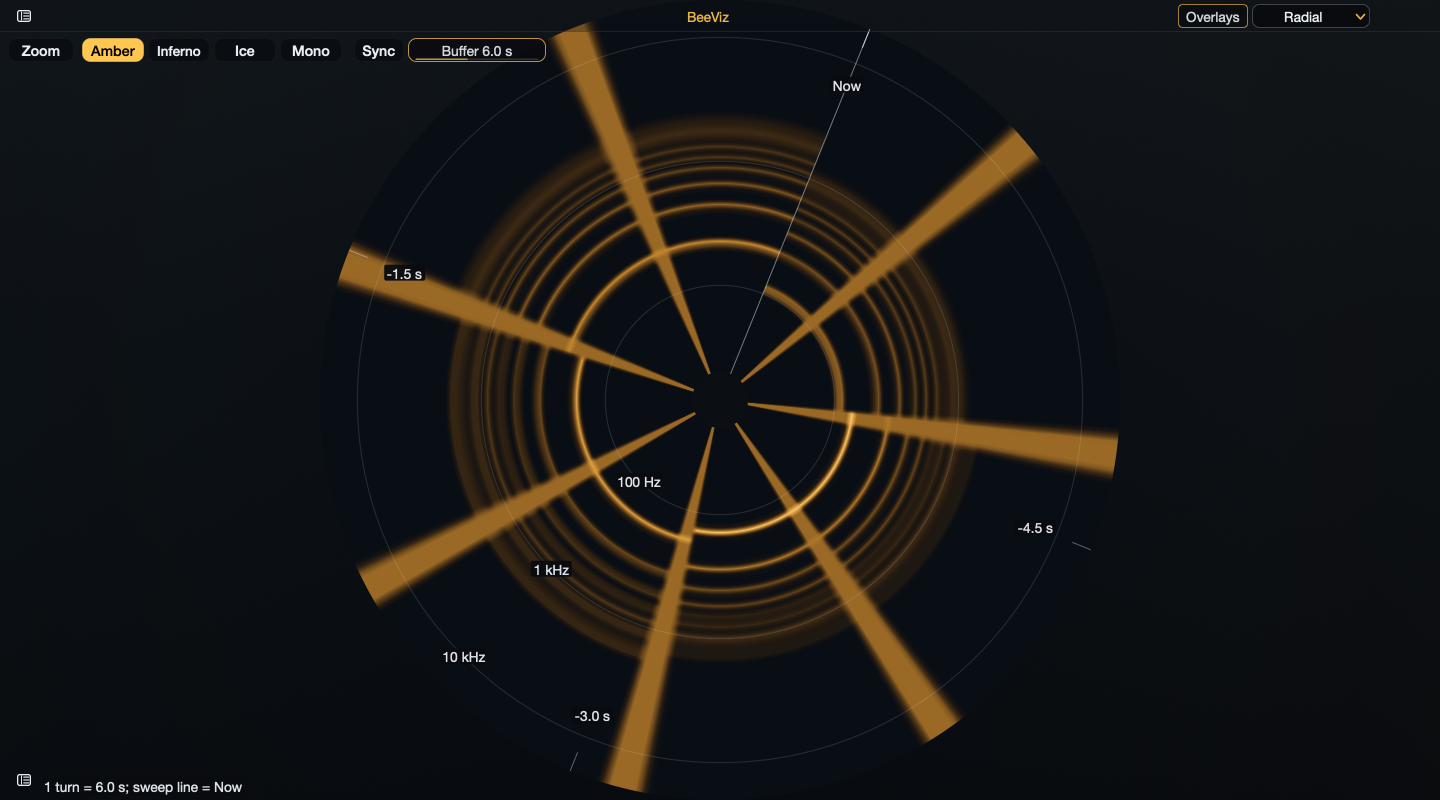
Select Radial to place time clockwise around a circle and low-to-high frequency from the inner edge outward. Labeled rings mark frequency. Quarter-turn markers show seconds with Sync off and fractions of a turn with Sync on. A sweep marker replaces the previous pass as it travels around the circle. Zoom expands the circle to the larger graph dimension and crops the overflow; turn it off to fit the whole circle. The color buttons use the same saved choice as Spectrogram.
With Sync off, Buffer sets one complete refresh to 1–30 seconds of real time. Drag left/right or scroll; double-click resets to 6 seconds. Sync changes that same slider to musical note durations at the host tempo. It uses 120 BPM when the host does not supply a usable tempo. T means triplet and D means dotted.
| Buffer choices | Quarter-note beats per rotation |
|---|---|
| 1/32, 1/16, 1/8 T, 1/8 | 1/8, 1/4, 1/3, 1/2 |
| 1/4 T, 1/8 D, 1/4, 1/4 D | 2/3, 3/4, 1, 3/2 |
| 1/2, 1/1, 2/1, 4/1 | 2, 4, 8, 16 |
At 120 BPM, 1/4 lasts half a second and 1/1 lasts two seconds. Double-click the synced slider to restore 1/1. Turning Sync off restores the independently retained seconds value. A tempo change adjusts sweep speed without resetting its position or discarding recorded events. Under Hold, tempo changes leave the captured history in place. Sync follows tempo; it does not align the sweep to the host’s song position or bar boundary.
Waterfall and Radial keep independent Buffer values. Their clocks follow elapsed real time even in hosts that process audio faster than playback. The sweep and history continue through silence; Hold pauses them. Attack and Release shape newly captured levels and the fade into silence, while Buffer sets how long those captures remain visible. Increasing Buffer preserves captured spectra and fills the longer window as new history arrives.
Overlays that require Spectrum or Spectrogram show Needs flat view in Waterfall and Radial. Their selections remain saved, and they can still be switched off. Meters and separate panels remain available.
Analyzer settings
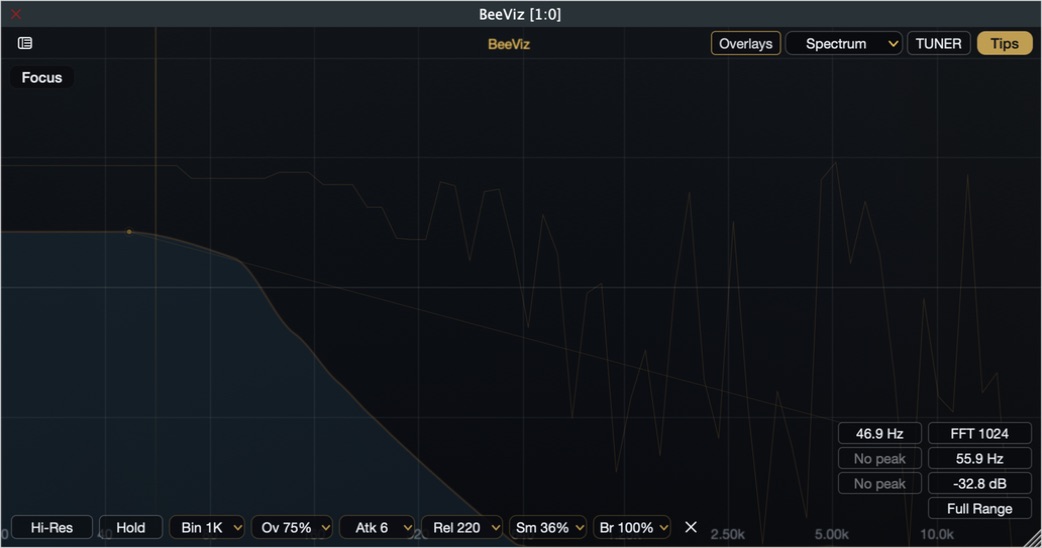
| Control | Choices; default | Effect |
|---|---|---|
| Hi-Res | Off / On; Off | Selects the tuned filterbank analysis path and its display. The tuning menu is described under Guides. |
| Hold | Off / On; Off | Freezes the spectrum and its histories. Release it before averaging a changing signal. Audio output and meters continue. |
| Bin | 256, 512, 1K, 2K, 4K, 8K; 1K | Sets FFT window length in samples when Hi-Res is off. K denotes 1024 samples. |
| Ov | 0%, 50%, 75%, 87.5%; 75% | Sets FFT overlap when Hi-Res is off. Higher overlap gives a shorter hop between analysis windows. The selected overlap is retained across display updates; a delayed update uses the newest complete window. |
| Atk | 0, 6, 15, 30, 60 ms; 6 ms | Sets the display response to rising spectral levels. |
| Rel | 80, 160, 220, 400, 800 ms; 220 ms | Sets the display response to falling spectral levels. |
| Sm | 0%, 18%, 36%, 60%, 80%; 36% | Smooths the displayed curve across frequency. |
| Br | 50%, 75%, 100%, 150%, 200%; 100% | Sets live-spectrum and spectrogram brightness. |
FFT mode uses a Hann window. For sample rate Fs and FFT length N, bin spacing is Fs / N and the window spans N / Fs seconds. At 48 kHz, 1024 samples span 21.33 ms with 46.875 Hz bin spacing; 8192 samples span 170.67 ms with 5.859 Hz spacing. Overlap changes the hop between windows, not their bin spacing. Windowing reduces spectral leakage at the cost of spreading a tone across neighboring bins. These are analysis tradeoffs, not tuner-accuracy specifications. SciPy, Spectral Analysis.
The live FFT curve retains frequency detail and calibrated tone levels across FFT sizes. Smoothing and the 72-bin summaries preserve narrow peaks. Spectrum and all three history displays extend the lowest measured FFT band to the 20 Hz display edge. This does not add low-frequency resolution; a readout still reports the measured bin frequency. Attack and Release follow elapsed audio time. Compare spectra under matching settings. Use Loudness Strip to measure signal level and the tuner to measure a sustained note’s fundamental.
Frequency Lens and cursor inspection
Press and hold the left mouse button on the graph to open the floating inspector. Drag while held to inspect another point; release or leave the graph to hide it. Hovering, right-clicking, and clicking a control leave it closed.
Spectrum reports frequency, note, live level, available reference level and difference, Mid/Side width, and transient rise. Spectrogram reports the captured frequency, note, level, and age relative to the newest column; Mid/Side reports both captured levels. When one history pixel contains several measurements, the readout shows its strongest peak. Each Focus pane uses its own scale. Readouts remain available under Hold and hide while you drag a Focus selection.
Enable Frequency Lens, then drag across the desired band. Drag horizontally in Spectrum, vertically in the default Spectrogram orientation, or horizontally with Rotate enabled. Spectrogram Focus reserves the overview drag for its time/frequency region; use Move Frequency Lens Here in the context menu to place the lens there. The lens dims the surrounding region. Its initial range is 120 Hz–8 kHz.
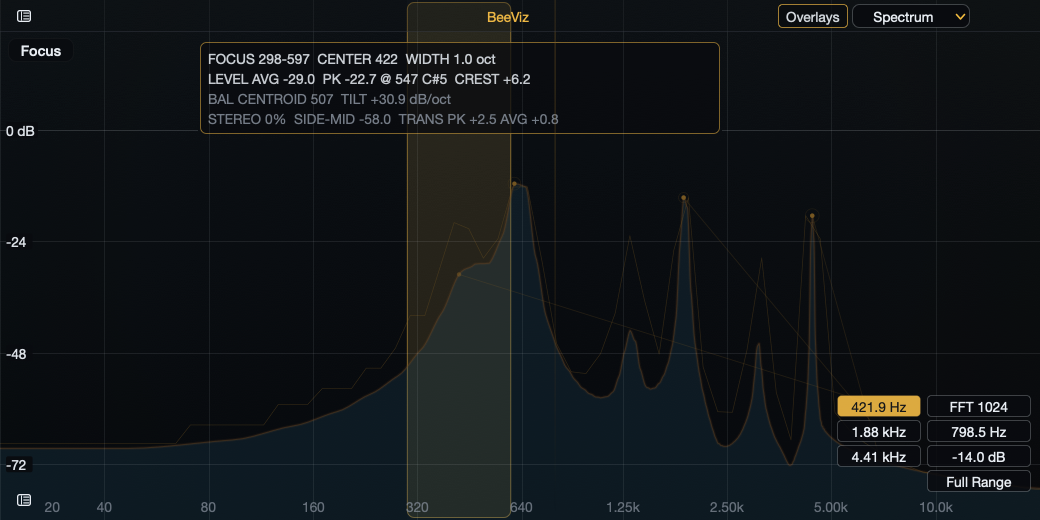
| Field | Calculation |
|---|---|
| FOCUS, CENTER, WIDTH | Band edges; geometric center √(low × high); width log₂(high / low) in octaves. |
| LEVEL AVG, PK, CREST | Average visual-bin power converted to dB; highest displayed bin and nearest note; peak minus that average. This CREST describes spectral bins, whereas Loudness Strip measures the audio signal. |
| BAL CENTROID, TILT | Power-weighted geometric mean frequency; regression of bin level against log₂ frequency, in dB/octave. The centroid uses logarithmic frequency; Fingerprint uses a power-weighted arithmetic mean in Hz. |
| REF, ERR | Live band power average minus reference band power average, in dB; mean absolute per-bin dB difference. Appears when a reference is available. |
| STEREO, SIDE-MID | 100 × Side power / (Mid power + Side power); Side average minus Mid average in dB. Appears when Side data is available. |
| TRANS PK, AVG | Largest and average transient-rise values within the selected band. |
Choose Frequency Zoom → Lens Focus to fill the graph with that selection. Dragging then updates the zoom. The lens is a visual selection; audition a band with another processor if required.
Reference Comparison
A reference contains stereo, Mid, and available Side visual levels from audio routed through this instance. BeeViz does not import a reference audio file. The captured bins are saved in the host project.
| Control | Behavior |
|---|---|
| Capture Reference | Stores the current displayed spectrum, including display response and smoothing. With Hold enabled, captures the held curve. Enabled after a valid analyzer frame arrives. |
| Average Reference | Accumulates power from the latest analyzed spectrum at each capture update for five seconds, weighted by newly processed frame count (up to 16 per update), then replaces the reference. This samples analyzer output across the capture period. Click again to finish early with the collected frames. |
| Clear Reference | Deletes the stored capture. |
| Reference | Shows or hides the stored curve. Hiding preserves its data. |
| Delta Spectrum | Shows live minus reference level by frequency. Positive values mean more live energy; negative values mean less. |
| Reference Difference | Labels the largest weighted deviations with frequency and dB difference. |
| Reference Match | Colors frequency regions according to the size of their live/reference difference. |
| Tonal Score | Summarizes reference similarity, low/mid/air differences, and available width difference. Requires a visible reference. Reference Check and Stereo/Phase Check presets enable it; it has no separate row in the current Overlay Manager. |
The comparison overlays require a captured reference. Their differences include level changes as well as spectral changes; they do not perform automatic loudness matching. Tonal Score measures similarity to that capture, not mix quality.
Overlay Manager
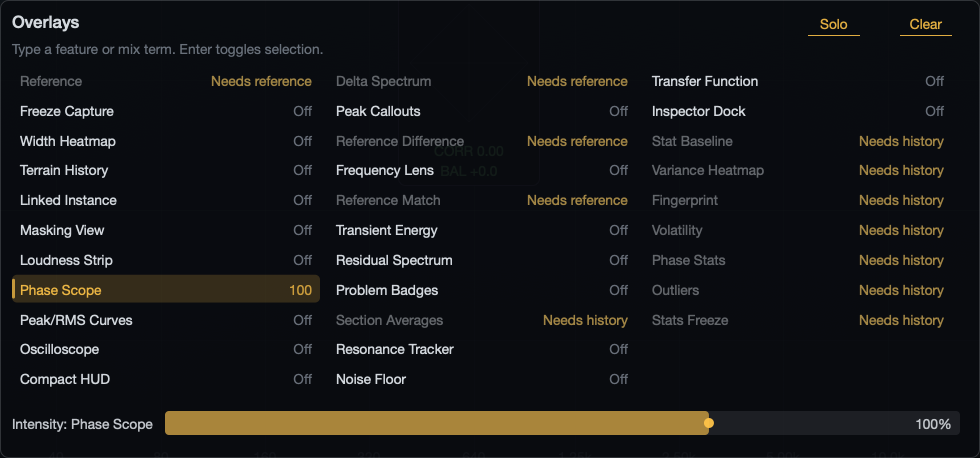
Click a row to activate it. Most rows toggle visibility; Linked Instance opens the peer browser and Freeze Capture operates the capture sequence. Active rows have an accent highlight. An inactive selected row has a neutral marker. Row order remains fixed when toggled.
Type a name or a keyword such as phase, reference, masking, or outlier to filter the list. A disabled row states its prerequisite, such as Needs reference, Needs history, or Needs bookmark. An active overlay can still be disabled after its source becomes unavailable.
The intensity slider adjusts an active selected overlay independently from the base spectrum, from 35% to 130%. An inactive or unavailable selection shows its name and Off/prerequisite message instead of a slider. Re-enabling it restores its saved intensity. These values scale visual intensity; they are not audio gain.
With Peak Callouts active and selected, Peak dots offers 1x, 1.5x, 2x, 3x, and 4x markers independently of opacity. The size follows project save/reload and Visual State A/B.
Panels move to make room for overlays, drawers, and controls. If they cannot all fit at a readable size, use Previous/Next to see the other panels. Enabling a panel brings it into view. Tooltips appear after one second and stay beside the control; dragging, scrolling, or moving the editor dismisses them.
Solo, or Shift-click, leaves the selected overlay active and hides the other managed overlays. Solo preserves existing freeze data and does not restart an armed capture. Solo on Linked Instance waits for a peer choice; Escape cancels that choice without changing the other overlays.
Clear hides managed overlays, cancels a pending freeze, and exits Lens Focus zoom. It retains captured references and completed freeze data. Some labels disappear when they would overlap another readout. Hide other panels to make room for them.
Spectral Overlays
Captures and history
| Overlay | Operation and reading |
|---|---|
| Freeze Capture | Arms separate analyzers for fresh post-click input and averages their spectral power. Finishes after at least four counted frames and 0.18 seconds, or times out at 1.25 seconds. Click while armed to cancel; click a visible completed freeze to hide it. Activating it again starts a new capture. This temporary snapshot is separate from the saved Reference. |
| Terrain History | Draws recent spectra as receding layers. Inspect decays, repeated events, or moving energy. It stays visible while you resize the window or open and close a drawer. |
| Peak/RMS Curves | Overlays short and long power averages, a decaying peak-hold curve, and a maximum-hold curve for the current analyzer run. These are per-frequency visual curves. |
| Section Averages | Averages the visual spectra between bookmarks retained in spectrogram history. Shows comparison curves in Spectrum and frequency-row overlays in Spectrogram. |
Use Section Bookmark in Controls while Spectrogram contains history. Each click marks the newest column as S1, S2, and so on. Up to 12 bookmarks are retained. Markers scroll with the image; Section Averages can only use the history still retained. The markers are independent of the DAW timeline.
Frequency features
| Overlay | Reading and limits |
|---|---|
| Width Heatmap | Compares Mid and Side energy by frequency. Low-frequency Side receives stronger emphasis. Use stereo input and Mid/Side Overlay; mono has no Side data. |
| Peak Callouts | Labels prominent local maxima with frequency and nearest note. Select this active row for its independent Peak dots control. The strongest peak can be a harmonic rather than the fundamental. |
| Transient Energy | Highlights rises between visual analyzer frames. Its time detail depends on the analyzer response and scheduling. |
| Residual Spectrum | Reduces displayed levels where bins fit an estimated harmonic series, leaving a residual curve or spectrogram edge strip. It estimates the remaining spectrum; it does not isolate noise or measure THD. |
| Resonance Tracker | Tracks persistent local maxima above the estimated floor. Labels show smoothed frequency, note, and hit count. A persistent peak alone does not establish a room mode or an unwanted resonance. |
| Noise Floor | Estimates a floor from low-percentile spectral bins, with peak-to-floor SNR, rumble, air-band, DC, and clip context. Tonal material, smoothing, and the visible spectrum affect the estimate; it is not a calibrated equipment-noise test. |
Persistent readouts
Inspector Dock keeps graph statistics visible without holding a mouse button: view mode, strongest peak, lens range and level, available reference difference and linked overlap, true peak, correlation, balance, crest, and overlay intensity. It sits on the left or right, depending on the space left by other panels.
Compact HUD shows a smaller summary of the strongest visible frequency, level, estimated noise floor, true peak, correlation, and warning count. Its spectral fields follow Frequency Zoom.
Linked Instances
- Open two or more BeeViz editors receiving audio in the same host process.
- Set a distinct Instance Name in each Controls drawer. Names are limited to 18 characters.
- Open Linked Instance in Overlay Manager. Select a named peer to follow it, or choose the automatic/latest-peer option.
- Enable the required linked display below.
The browser shows recent peers with age, Mid/Side availability, overlap score, and a spectrum preview. Use Previous/Next, the mouse wheel, or Page Up/Page Down to reach every live peer when the list spans multiple pages. Shift-click a peer to pin its name; up to eight names are stored. A pin does not keep a closed editor active. Peers older than three seconds are excluded from the live list. Hosts that isolate plugins in separate processes can prevent discovery.
| Overlay | Behavior |
|---|---|
| Linked Instance | Draws the selected peer's stereo spectrum, or its available Mid/Side curves in Mid/Side Overlay. |
| Masking View | Highlights active frequency overlap with the selected peer, weighted by relative level. Use it to locate bands for listening comparisons; overlap is not proof of audible masking. |
| Linked Matrix | Enabled by the Multi-Instance Masking preset; it has no separate Overlay Manager row. Shows pairwise overlap scores for the current instance and up to five other open editors. Warmer cells indicate greater scored overlap. |
| Transfer Function | Uses the selected available linked peer, otherwise a captured reference. Shows the live-minus-comparison curve, average offset, average error, and an overlap score. |
These comparisons share visual snapshots. They do not transfer audio or align the two signals in time. Transfer Function is a magnitude comparison: it does not estimate an impulse response, phase response, or cross-spectral coherence. Its result includes source differences when the instances receive different material.
Choose Off in the peer browser to hide Linked Instance, Masking View, and Linked Matrix. Transfer Function can still use a captured reference.
Processing Reference
Loudness Strip
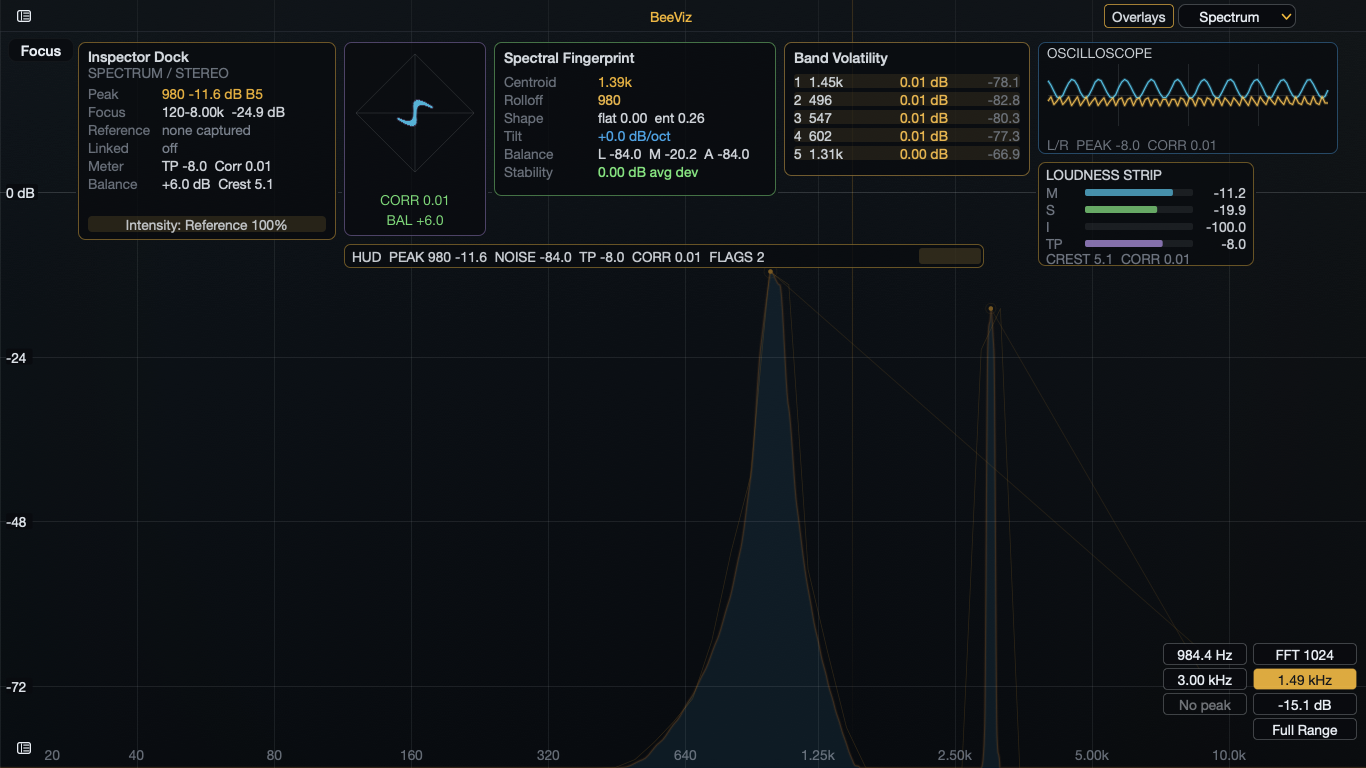
Loudness Strip shows momentary, short-term, and integrated loudness in LUFS, true peak, crest factor, and correlation. K-weighting filters are calculated for the active sample rate. Front channels have a power weight of 1.0, surrounds 1.41, and LFE 0.0 in loudness calculation. LFE remains included in peak, clip, crest, and DC measurements. K-weighting, channel weighting, and true-peak reconstruction are described in ITU-R BS.1770-5.
| Reading | Calculation |
|---|---|
| Momentary | Trailing 400 ms of K-weighted energy, using an exact sample-count window. |
| Short-term | Trailing three seconds of K-weighted energy, using an exact sample-count window. |
| Integrated | Non-overlapping 400 ms energy blocks. Rejects blocks below −70 LUFS, then those more than 10 LU below the absolute-gated average. Retains up to 4096 blocks, approximately 27 minutes 18 seconds, before replacing the oldest. |
| Sample peak | Largest absolute input sample across active channels, with display decay. |
| True peak | Four-times interpolation on every active channel, using four phases of 12 taps each. Filter history continues across host blocks. The displayed peak decays. |
| Crest | Current host-block sample peak minus RMS level in dB. RMS includes all active channels. |
| Correlation | Normalized left/right cross-product for the current host block. +1 indicates matching polarity, −1 opposing polarity, and values near zero weak correlation. Silence is not a useful phase measurement. |
| Balance | Left/right average-power ratio in dB. Positive means greater left energy; negative means greater right energy. |
| DC | Mean sample value across the current block and active channels, as a percentage of full scale. Opposite channel offsets can cancel in this aggregate. |
| Clip count | Cumulative channel-sample count with absolute level at least 0.999969. It counts samples near full scale, not separate clipping events or proof of upstream clipping. |
Reset Meters clears the loudness, peak, clip, and associated meter histories on the next processed block. Preparing or releasing the processor also resets them. Metering continues with the editor closed while the host supplies audio; the host can suspend processing independently.
BeeViz's integrated blocks use no overlap; EBU Mode specifies 75% overlap for its 400 ms gating blocks. BeeViz also bounds the history and displays a decaying true peak. It has no compliance certification or EBU Mode claim. Use a meter validated for the required delivery standard when checking programme loudness, loudness range, or maximum true peak. EBU Tech 3341, sections 2.2–2.6.
Phase Scope and Oscilloscope
Phase Scope plots the first left/right pair with correlation. Matching channels form a narrow vertical trace. Horizontal spread can indicate Side energy or opposing polarity. Mono produces a centered trace. Read it over the relevant passage, then check the host's mono sum when assessing cancellation.
Oscilloscope displays left/right sample traces from the current meter snapshot. Each trace contains up to 96 points sampled across a host block. It can show polarity and gross waveform shape; subsampling can omit short events, and the display is not a continuous recorded waveform.
Problem Badges
Enable Problem Badges to show up to seven active flags. Each flag uses a fixed threshold. Frequency-band comparisons use the displayed spectral data.
| Badge | Condition |
|---|---|
| TRUE PEAK | Displayed true peak above −1 dB. |
| CLIP | Clip count greater than zero since reset. |
| DC | Absolute aggregate DC offset above 1%. |
| PHASE / LOW CORR | Correlation below −0.15 / below 0.18. PHASE takes precedence. |
| BAL | Absolute left/right balance difference above 4 dB. |
| RUMBLE | 20–45 Hz average exceeds 80–250 Hz by more than 5 dB and exceeds −58 dB visual level. |
| HARSH | 2.5–6 kHz average exceeds 250 Hz–1.5 kHz by more than 7 dB and exceeds −52 dB visual level. |
| SIBILANCE | 5.5–10 kHz average exceeds 250 Hz–1.5 kHz by more than 8 dB and exceeds −56 dB visual level. |
| WIDE SUB | 20–120 Hz Side average is greater than Mid minus 9 dB and exceeds −62 dB visual level. |
| REF DRIFT | Mean absolute live/reference difference across 80 Hz–12 kHz exceeds 8.5 dB. |
NO FLAGS means none of these conditions was found in the available data. A flag marks a measurement to check. It may be intentional: a bass-heavy arrangement can trigger RUMBLE. Listen to the indicated band and source before changing the mix.
Rolling Statistics
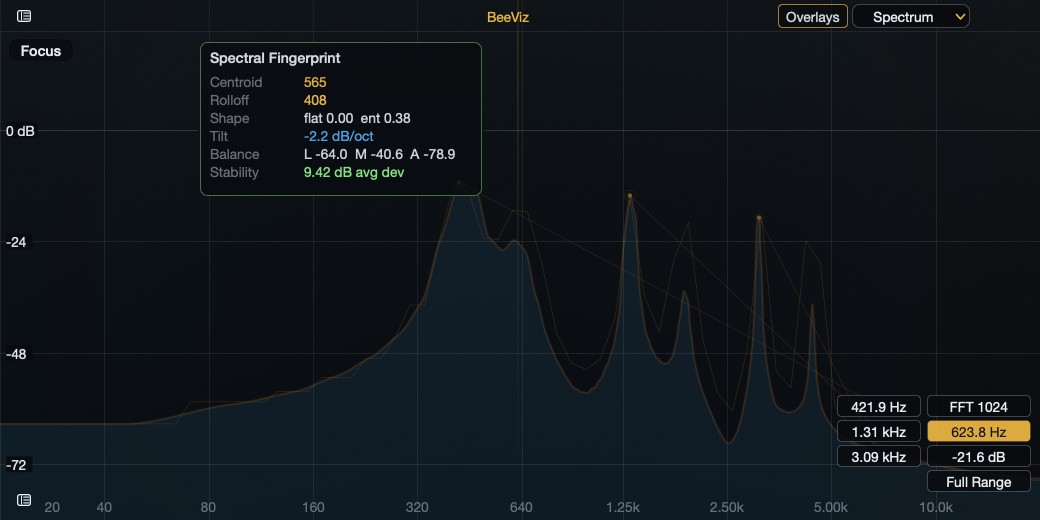
BeeViz retains up to 256 recent visual frames, with 72 bins per frame. The statistical views become available after four frames. This is a rolling display history, not a fixed number of seconds or a full recording. Analyzer scheduling and CPU Mode affect how much elapsed time it covers.
For each bin, BeeViz calculates the mean, median, 10th and 90th percentiles, minimum, maximum, and population standard deviation of its dB values. This dB mean differs from the power average used by Average Reference. Use the same capture method and analyzer settings when comparing distributions.
| Row | Operation and reading |
|---|---|
| Stat Baseline | Captures the current rolling distribution the first time it is enabled. Draws mean, median, and percentile spread. Later clicks hide or reveal the same baseline within this editor session. |
| Variance Heatmap | Colors bins by rolling standard deviation. Higher deviation means more level movement in that history. |
| Fingerprint | Summarizes centroid, 85% rolloff, flatness, entropy, tilt, low/mid/air balance, and average deviation. |
| Volatility | Ranks bins by standard deviation and lists frequency, deviation, and mean level. |
| Phase Stats | Uses rolling Mid/Side powers to calculate (Mid power − Side power) / (Mid power + Side power) per bin, with a numerical floor. This is a correlation-like width indicator, not the sample-domain correlation meter. Mono is identified separately. |
| Outliers | Compares the current dB level with its rolling mean: z = (level − mean) / max(standard deviation, 0.85 dB). In Spectrum, bins with |z| at least 2.2 are marked and the largest are labeled. |
| Stats Freeze | Captures the current distribution. Click a visible freeze to hide it; activating it again captures the then-current distribution. Use it for a second temporary distribution alongside Stat Baseline. |
A percentile describes the distribution of observed frames, not a confidence interval. A z-score describes distance from the recent mean in units of deviation; it does not assign a probability that a sound is faulty. Small samples and the distribution of the data affect outlier interpretation. NIST, Detection of Outliers.
In Fingerprint, centroid indicates the frequency center of spectral power; rolloff marks the frequency below which 85% of the summarized power lies. Flatness compares geometric and arithmetic power means; entropy describes the spread of normalized power across bins. Tilt expresses level slope in dB per octave. These statistics describe the analyzed spectrum and change with its settings.
Use Deep Report to export the current distribution before closing the editor or resetting analyzer history. Saved visibility does not preserve the captured distributions.
Guides
Guide choices are in Controls. They draw frequency or level references without applying an audio filter, EQ, loudness target, or playback-system simulation.
| Control | Choices and use |
|---|---|
| Target Curve | Off, Modern Mix, Bass Heavy, Club, Orchestral, Voice/Podcast, Streaming Master. Displays the selected contour and a tolerance band. The names are reference profiles, not delivery specifications. |
| Harmonic Grid | Off or root C through B. Draws root/octave lines with lighter third and fifth guides. |
| Tilt Profile | Off, Flat, Pink −3 dB/oct, Master −4.5 dB/oct, Club Smile, Voice Focus. Adds a comparison guide; it does not recalibrate the analyzer data. Flat is a horizontal guide at −42 dB visual level; Off hides the guide. |
| Frequency Zoom | Full range, Sub/Low 20–250 Hz, Low-Mid 80 Hz–1 kHz, Mid 250 Hz–4 kHz, Presence 1–8 kHz, Air 4–20 kHz, Lens Focus. Changes the displayed range and matching overlay positions. |
| Translation Check | Off, Phone, Car, Club, Laptop, Vinyl, Mono. Shades frequency regions associated with the selected check. Audition the actual system or mono sum to assess translation. |
Hi-Res Tuning
Hi-Res Tuning selects the center-frequency layout for the 121-band filterbank and the temperament used by the tuner.
| Choice | Pitch definition |
|---|---|
| 12-TET A440 | Twelve equal semitones per octave, anchored at A4 = 440 Hz. Default. |
| 12-TET A432 | Equal temperament anchored at A4 = 432 Hz. |
| Pythagorean A440 | Fixed Pythagorean chromatic ratios anchored at A4 = 440 Hz. |
| Just Major A440 | Fixed five-limit just-major chromatic ratios anchored at A4 = 440 Hz. |
| 1/4-Comma Meantone A440 | Fixed quarter-comma meantone chromatic ratios anchored at A4 = 440 Hz. |
Changing the built-in choice resets the tuner's A4 reference to 432 or 440 Hz as named. Adjust the tuner A4 control afterward for a custom reference. FFT mode remains based on FFT bins; a tuning-menu change does not move those bins. Harmonic Grid's root selector is a separate guide control.
Tuner
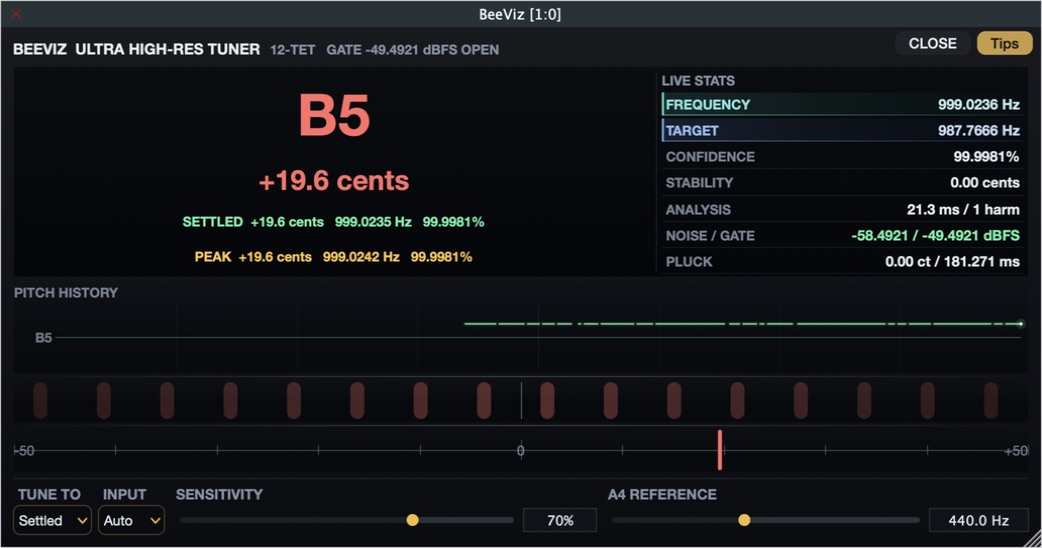
Click TUNER or press Shift-T. Select the input and reference, then play one note at a time. Damp other strings and allow the note to sustain. Use Close or Escape to return to the analyzer.
Tuner controls
| Control | Choices and behavior |
|---|---|
| Tune To | Settled (default) or Peak. Selects the measurement driving the main cents value, needle, and strobe. The two captured measurements remain visible below the note. |
| Input | Auto (default), Left, Right, or Mid. Auto uses channel-level hysteresis to avoid switching between nearly equal channels. Mid analyzes (L + R) / 2 from the first stereo pair. Select a channel explicitly when the sources differ or cancel in Mid. |
| Sensitivity | 0–100% in 1% steps; default 70%. Higher values admit quieter input. Controls an analysis-only downward expander and adaptive gate. |
| A4 Reference | 410–480 Hz in 0.1 Hz steps; initial value 440 Hz. Sets the tuner's concert-pitch anchor. Temperament is selected in Hi-Res Tuning. |
| Live Stats rows | Click a row to toggle visual priority. Frequency and Target are emphasized initially. The chosen priorities are saved. |
Pitch readings
The note label gives the nearest target note and octave. Frequency is the live frequency estimate; Target is that note's frequency under the selected temperament and reference. Decimal places indicate display resolution, not a guaranteed measurement tolerance.
Signed cents error is 1200 × log2(measured frequency / target frequency). Positive is sharp and negative is flat. The needle spans −50 to +50 cents; the strobe's direction follows the sign of the selected error, and its speed increases with the error. The logarithmic frequency/interval relationship is given by UNSW, Note names, MIDI numbers and frequencies.
Peak Pitch is the 90th percentile of accepted attack estimates. Confidence gating and the percentile calculation reduce the influence of isolated high estimates. Picking force and attack technique affect this reading.
Settled Pitch is the median of recent accepted sustain estimates. It can measure a continuous oscillator without a pluck. A confirmed note change starts a new set of estimates.
Pitch Drop is Peak minus Settled, expressed as a pitch interval. A positive drop means the attack began higher. Settling Time runs from the detected pluck to the start of stable sustain.
When pitch is lost or the gate closes, the note, cents needle, Peak/Settled readouts, and current-pitch highlight clear immediately. Previous notes remain in Pitch History. The waiting message tells you whether the gate is open and searching for a fundamental or closed and waiting for input.
Pitch History retains eight seconds of live estimates with an automatically scaled note axis. New data enters at the right. The trace breaks when the gate closes and preserves changes in center note. It shows live pitch rather than only the held Peak or Settled value.
Live Stats and gating
| Row | Interpretation |
|---|---|
| Confidence | How strongly the waveform repeats at the estimated pitch. It is not a probability that the tuning is correct. |
| Stability | Short-term variation of accepted pitch estimates. Vibrato, beating, and changing notes can increase it. |
| Analysis | Current analysis-window duration and harmonic evidence count. |
| Noise / Gate | Estimated noise floor and effective gate threshold. The header also reports OPEN or CLOSED. |
| Pluck | Pluck-detection and settling status for the current measurement. |
Sensitivity sets the expander threshold from −30 dBFS at 0% to −90 dBFS at 100%. At the default 70%, it is −72 dBFS. The analysis expander uses a 3:1 ratio below threshold.
The gate estimates persistent unpitched input and places its threshold 9 dB above that floor, subject to the Sensitivity setting. It estimates noise around a detected note without treating the ringing note as background noise. Separate opening and closing thresholds reduce repeated switching. The detector keeps listening while the gate is closed, so quieter pitched input can reopen it.
If a quiet note is rejected, increase Sensitivity and check the input level. If unpitched background activity persists, reduce Sensitivity and inspect Noise / Gate. Changing these settings affects the tuner analysis branch.
Estimation method and limits
The tuner searches for fundamentals from 20 Hz to 5 kHz. It uses an adaptive YIN/autocorrelation candidate followed by phase-drift refinement from the fundamental and up to eight harmonics. YIN's periodicity estimator is described by de Cheveigné and Kawahara, 2002; the phase refinement and attack/sustain capture are BeeViz implementation details.
Analysis windows range from 1024 to 8192 effective samples. Low notes require longer windows to include enough cycles. A detected onset temporarily shortens the window for attack capture. Above 48 kHz, filtered decimation reduces the analysis sample rate. The engine publishes on a 128-effective-sample grid; that interval is not the total acquisition time or the screen refresh rate.
The tuner analyzes incoming audio on a background thread. Opening the tuner starts analysis; closing it or the plugin editor stops it. Hiding or minimizing the editor also pauses tuner analysis. Showing it again resumes the selected page. If analysis falls behind, it skips old input and resumes with recent audio.
Chords, overlapping notes, strong noise, beating strings, and weak fundamentals can produce an ambiguous result. Use one sustained note and check the displayed octave. The frequency scale depends on the host sample rate; BeeViz does not calibrate the audio interface's physical clock.
Presets, State, and Host Behavior
Quick presets and clipboard sharing
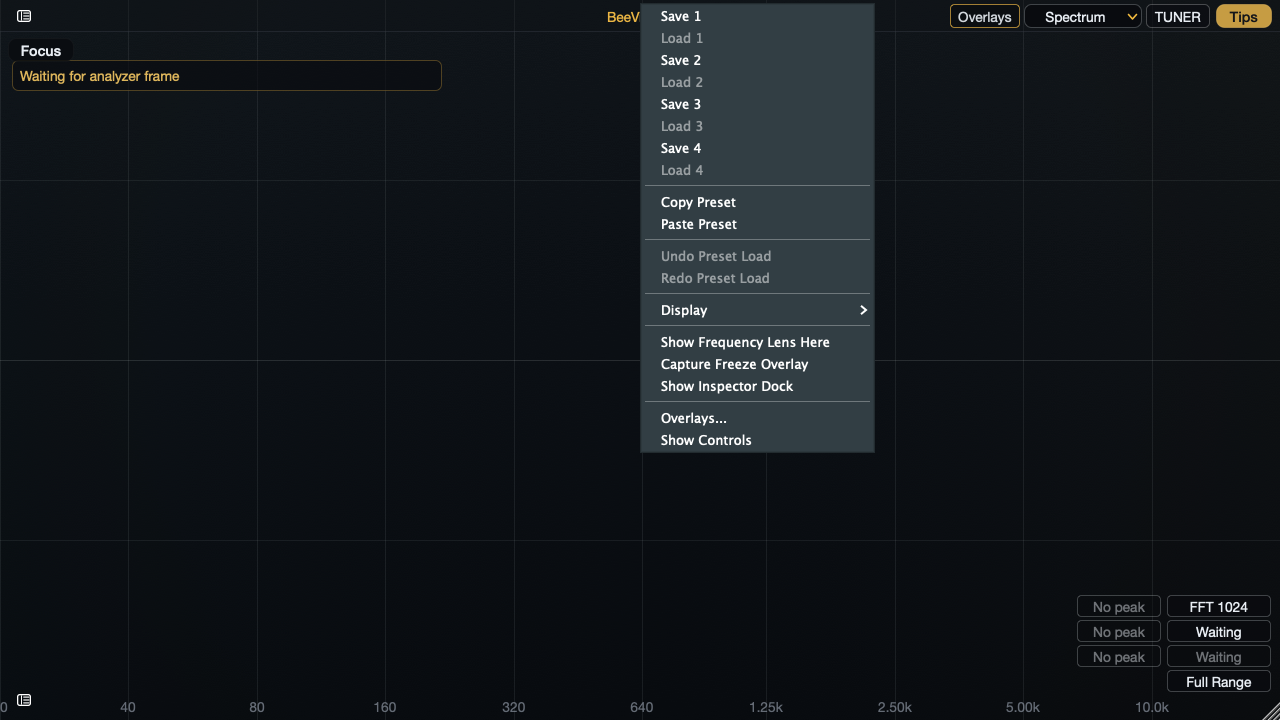
Right-click the analyzer graph or an empty area of the tuner. The menu lists Save 1 / Load 1 through Save 4 / Load 4.
- Set up the analyzer or tuner.
- Choose Save 1, Save 2, Save 3, or Save 4 to store the current setup. Saving replaces anything already in that slot.
- Choose the matching Load command to recall it.
The four slots start empty, with Load disabled. All BeeViz instances under your user account share them, including after restarting the host or computer. A host project saves its own current setup; later changes to a quick slot do not change the saved project.
Quick presets store analyzer settings, display and overlay choices, guides, captured reference spectra, instance and linked-peer choices, and tuner settings. Tuner settings include the custom A4 reference and whether the tuner page is open. Loading a preset keeps the receiving instance's Visual State A/B slots. Live history, meter holds, temporary Freeze captures, and statistical distributions are not saved in presets.
Copy Preset copies the current setup as a BeeAudio preset-sharing link. Paste Preset accepts a compatible BeeViz link or its payload token and applies it immediately. Invalid text and presets from other products show an error and leave the setup unchanged. Clipboard presets contain the same settings as quick slots.
Undo Preset Load and Redo Preset Load reverse a recall or paste. They do not undo saving over a quick slot.
Visual Presets
Select a factory layout under Visual Presets in Controls. These layouts set views, overlays, and guides. Capture a reference, select a linked peer, or collect history when the chosen overlays require it.
| Preset | Enabled views |
|---|---|
| Clean Analyzer | Stereo Spectrum; overlays and guides off. |
| Reference Check | Available Reference, Tonal Score, Delta Spectrum, Reference Match, Peak Callouts, Reference Difference, Problem Badges, Compact HUD. |
| Stereo/Phase Check | Mid/Side Overlay, Width Heatmap, Tonal Score, Phase Scope, Loudness Strip, Oscilloscope, Problem Badges. |
| Deep Statistics | Stat Baseline, Variance Heatmap, Fingerprint, Volatility, Phase Stats, Outliers, Problem Badges, Compact HUD, Inspector Dock. |
| Spectrogram Forensics | Spectrogram, Terrain History, Transient Energy, Peak Callouts, Residual Spectrum, Resonance Tracker, Noise Floor, Frequency Lens, Problem Badges; Section Averages when bookmarks exist. |
| Multi-Instance Masking | Linked Instance, Masking View, Linked Matrix, Transfer Function, Loudness Strip, Problem Badges, Compact HUD. |
Visual State A/B
Visual State A and Visual State B hold two user-defined analyzer setups. Click an empty slot to capture the current setup; click a populated slot to recall it. Update A/B replaces the active slot. Copy To A/B writes the current setup to the opposite slot.
Slots contain analyzer settings, display mode, each Focus setting and selected region, Spectrogram rotation, history colors, independent Waterfall/Radial Buffer values, Radial Zoom and Sync/note choice, overlays and intensities, Peak Callout dot size, lens range, guides, Hi-Res Tuning, CPU Mode, and instance/link choices. The two slots share the instance's captured reference. Tuner-specific controls are saved separately from visual A/B.
Saved and temporary data
| Saved with the host project | Temporary measurement or editor data |
|---|---|
| Analyzer settings, display/Focus/Rotate choices, history colors and Buffer values, Radial Sync/note choice and Zoom, overlays/intensities and peak dot size, lens range, guides, CPU Mode. | Hold, spectrum/spectrogram history, terrain, Peak/RMS holds, section bookmarks, and transient/resonance history. |
| Captured Reference levels and visibility; visual A/B slots. | Freeze Capture, rolling distributions, Stat Baseline and Stats Freeze contents. Their visibility settings can return before fresh data is available. |
| Instance name, selected peer name, and pinned names. | Live peer snapshots and discovery entries. |
| Tuner page selection, A4 reference, sensitivity, input, Tune To, and Live Stats priorities. | Tuner estimates, captured note measurements, and pitch history. |
Theme is a persistent preference shared by BeeViz AU, VST3, CLAP, and Standalone instances on this computer. Open instances follow changes, new instances inherit them, and restarting the application retains the choice. Loading a project does not replace that preference. Light uses darker analyzer text and backed frequency labels for readability over data.
Closing the editor clears its visual histories and stops sharing snapshots with linked instances. Reopening restores the saved view choices; a saved tuner page restarts analysis. Meter histories continue while the host processes audio, but they are not saved in the project.
CPU Mode and display activity
CPU Mode cycles Eco, Normal (default), and Detail. Eco halves the rate of spectrum updates and runs the more demanding visual updates half as often. Detail raises the spectrum update rate by 50% relative to Normal. CPU Mode does not change continuous metering or tuner input capture.
To reduce display work, select Clean Analyzer or Spectrum, disable unused overlays, choose Eco, or close unused editors. FFT size, overlap, and Hi-Res also affect analysis work. Reduced Motion in the title menu reduces animated visual effects; brightness changes image intensity. Hidden or minimized editor containers resume analysis when shown again. The tuner page keeps analyzer controls out of keyboard navigation until you return to the analyzer.
Export
Export commands are in Controls. Files are saved to your Desktop with timestamped names. Some exports also include your custom instance name. Export status appears in the graph. After Deep Report, click OPEN to open an exported file; check that all required formats were written.
| Command | Files | Contents |
|---|---|---|
| Export PNG | PNG | Snapshot of the analyzer panel, including the live spectrum and visible overlays. |
| Export Analysis | CSV, JSON | 72 visual-bin rows: frequency, note, live level, available reference/delta, Mid/Side/width, residual, transient rise, linked level/masking, target and tilt values. JSON includes view metadata, meter values, badges, and linked scores. |
| Export Report | PNG, HTML, PDF | Analyzer snapshot, meter readings, badges, and band summary in HTML; a compact text summary in PDF. |
| Deep Report | CSV, JSON, HTML, PDF | Rolling per-bin distribution, summary metrics, volatility, outliers, and phase estimates. Requires at least four history frames. HTML and PDF present summaries rather than all raw rows. |
These exports contain images, numbers, and text. They do not contain recorded audio or tuner history. Reference and linked fields depend on the data available at export time. Use Deep Report before discarding a distribution you need to retain.
Troubleshooting
| Symptom | Check and action |
|---|---|
| Graph is blank or stopped | Confirm audio reaches this insert, open the editor, clear Hold, and check whether the host has suspended processing. History needs fresh frames. |
| Side view is absent | Check the host channel layout. Mono has no Side; identical stereo channels also produce zero Side energy. |
| Reference controls are disabled | Play audio until a valid frame arrives, then capture. Comparison overlays require the stored capture; Tonal Score also requires Reference visibility. |
| Comparison changes after a display-setting change | The stored reference was measured with the earlier settings. Recapture under the same settings as the live analysis. |
| Linked peer is missing | Keep the peer editor open and receiving frames. Check process isolation and distinct instance names. Pins retain names, not live data. |
| Statistics or section views are unavailable | Collect at least four frames for statistics. For sections, enable Spectrogram and add a bookmark after history begins. |
| Stat Baseline does not change when toggled | Toggling reveals the original baseline. Use Stats Freeze for a new temporary capture or reopen the editor to start a new history and baseline. |
| Tuner shows an unexpected note or octave | Damp other notes, check Input and Hi-Res Tuning, and inspect the A4 reference. Allow a low note enough sustained cycles. |
| Tuner clears while a note is still ringing | Increase Sensitivity to retain quieter input, check the selected Input, and inspect Noise / Gate. Loss of pitch clears the current marker; the history trace remains for comparison. |
| Graph hover shows no readout | Press and hold the left mouse button directly on Spectrum or Spectrogram. Use Inspector Dock for persistent statistics. |
| Radial note timing differs from the song | Check Sync and the host tempo supplied to the plugin. Missing tempo uses 120 BPM; the sweep follows duration without locking to a song-position boundary. |
| Peak tuning differs between plucks | Use repeatable picking force and location. Choose Settled to compare sustain pitch. |
| Loudness differs from another meter | Match routing, channel layout, reset time, and measured passage. Account for BeeViz's non-overlapping integrated blocks, bounded history, and peak decay. |
| Export file is missing | Read the export status, check Desktop write permission and free space, and verify that the requested analysis data exists. |
| Overlay label is missing | Check prerequisites, intensity, and the current panel page. Some overlays require Spectrum or Spectrogram. Hide other panels or zoom into the band to make room for labels. |
| Quick preset Load is disabled | The slot is empty. Use its Save command to store a setup first. |
| Paste Preset reports an error | Copy a complete BeeViz preset link or payload token. Presets from other Bee products are not accepted. The error leaves the current setup unchanged. |
| Shortcut has no effect | Click the graph for focus, or use the corresponding button. Full screen also requires a compatible containing window. |
Research and References
This manual covers the September 21 display updates and September 22 preset updates. These were reviewed on separate development branches; available controls depend on the build you use. The references below describe the analysis methods and measurement conventions. They do not certify BeeViz’s measurements.
- ITU-R BS.1770-5, Algorithms to measure audio programme loudness and true-peak audio level, November 2023.
- EBU Tech 3341, Loudness Metering: “EBU Mode”, November 2023, sections 2.2–2.6.
- de Cheveigné and Kawahara, YIN, a fundamental frequency estimator for speech and music, JASA 111(4), 1917–1930, 2002. DOI: 10.1121/1.1458024.
- SciPy Signal Processing tutorial, Spectral Analysis.
- NIST/SEMATECH Engineering Statistics Handbook, Detection of Outliers.
- UNSW Music Acoustics, Note names, MIDI numbers and frequencies.